Zip Codes with the Highest Percentage of Population Employed in Real Estate, Rental & Leasing in Birmingham, AL
RELATED REPORTS & OPTIONS
Real Estate, Rental & Leasing
Birmingham
Compare Zip Codes
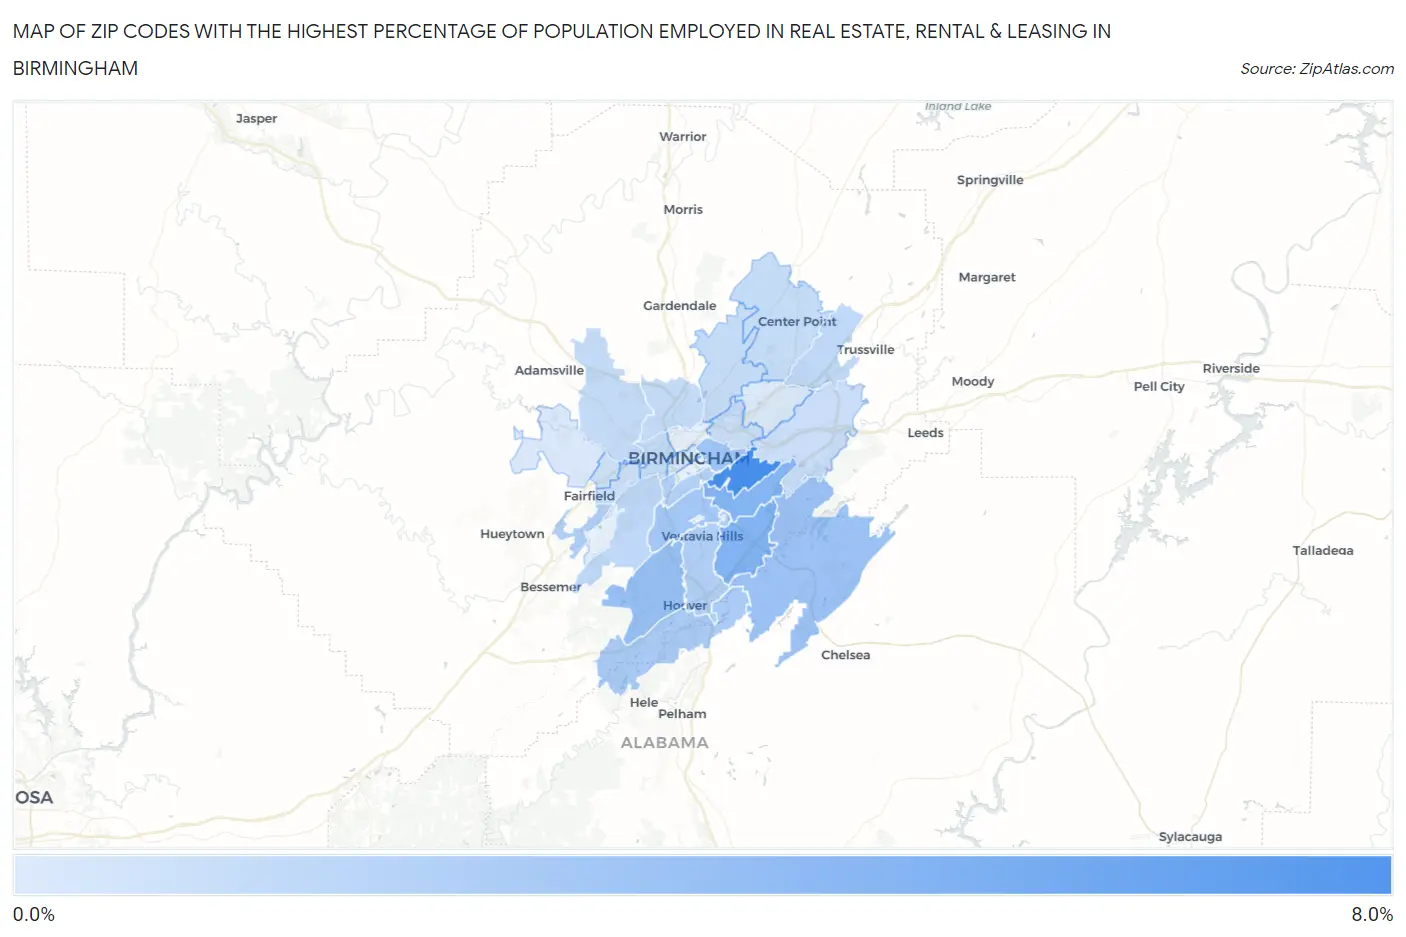
Map of Zip Codes with the Highest Percentage of Population Employed in Real Estate, Rental & Leasing in Birmingham
0.28%
6.5%
Zip Codes with the Highest Percentage of Population Employed in Real Estate, Rental & Leasing in Birmingham, AL
| Zip Code | % Employed | vs State | vs National | |
| 1. | 35213 | 6.5% | 1.5%(+4.96)#12 | 1.9%(+4.61)#820 |
| 2. | 35243 | 4.0% | 1.5%(+2.49)#35 | 1.9%(+2.14)#2,128 |
| 3. | 35223 | 4.0% | 1.5%(+2.46)#38 | 1.9%(+2.11)#2,173 |
| 4. | 35226 | 3.1% | 1.5%(+1.60)#51 | 1.9%(+1.25)#3,537 |
| 5. | 35242 | 2.9% | 1.5%(+1.33)#59 | 1.9%(+0.980)#4,244 |
| 6. | 35222 | 2.7% | 1.5%(+1.16)#67 | 1.9%(+0.807)#4,752 |
| 7. | 35209 | 2.6% | 1.5%(+1.09)#69 | 1.9%(+0.739)#4,997 |
| 8. | 35244 | 2.3% | 1.5%(+0.770)#87 | 1.9%(+0.419)#6,265 |
| 9. | 35216 | 2.1% | 1.5%(+0.528)#111 | 1.9%(+0.177)#7,481 |
| 10. | 35205 | 2.0% | 1.5%(+0.471)#116 | 1.9%(+0.120)#7,771 |
| 11. | 35228 | 2.0% | 1.5%(+0.431)#121 | 1.9%(+0.079)#7,999 |
| 12. | 35211 | 1.5% | 1.5%(-0.067)#189 | 1.9%(-0.418)#11,367 |
| 13. | 35235 | 1.5% | 1.5%(-0.084)#190 | 1.9%(-0.436)#11,528 |
| 14. | 35207 | 1.3% | 1.5%(-0.223)#208 | 1.9%(-0.574)#12,595 |
| 15. | 35214 | 1.3% | 1.5%(-0.254)#211 | 1.9%(-0.605)#12,830 |
| 16. | 35215 | 1.2% | 1.5%(-0.355)#223 | 1.9%(-0.706)#13,605 |
| 17. | 35204 | 1.2% | 1.5%(-0.363)#224 | 1.9%(-0.714)#13,678 |
| 18. | 35217 | 1.2% | 1.5%(-0.365)#226 | 1.9%(-0.717)#13,705 |
| 19. | 35210 | 1.1% | 1.5%(-0.473)#247 | 1.9%(-0.825)#14,564 |
| 20. | 35212 | 1.1% | 1.5%(-0.489)#252 | 1.9%(-0.841)#14,705 |
| 21. | 35218 | 0.87% | 1.5%(-0.670)#274 | 1.9%(-1.02)#16,186 |
| 22. | 35208 | 0.85% | 1.5%(-0.689)#277 | 1.9%(-1.04)#16,335 |
| 23. | 35203 | 0.57% | 1.5%(-0.970)#327 | 1.9%(-1.32)#18,520 |
| 24. | 35224 | 0.41% | 1.5%(-1.13)#364 | 1.9%(-1.48)#19,726 |
| 25. | 35206 | 0.28% | 1.5%(-1.26)#377 | 1.9%(-1.61)#20,573 |
1
Common Questions
What are the Top 10 Zip Codes with the Highest Percentage of Population Employed in Real Estate, Rental & Leasing in Birmingham, AL?
Top 10 Zip Codes with the Highest Percentage of Population Employed in Real Estate, Rental & Leasing in Birmingham, AL are:
What zip code has the Highest Percentage of Population Employed in Real Estate, Rental & Leasing in Birmingham, AL?
35213 has the Highest Percentage of Population Employed in Real Estate, Rental & Leasing in Birmingham, AL with 6.5%.
What is the Percentage of Population Employed in Real Estate, Rental & Leasing in Birmingham, AL?
Percentage of Population Employed in Real Estate, Rental & Leasing in Birmingham is 1.7%.
What is the Percentage of Population Employed in Real Estate, Rental & Leasing in Alabama?
Percentage of Population Employed in Real Estate, Rental & Leasing in Alabama is 1.5%.
What is the Percentage of Population Employed in Real Estate, Rental & Leasing in the United States?
Percentage of Population Employed in Real Estate, Rental & Leasing in the United States is 1.9%.