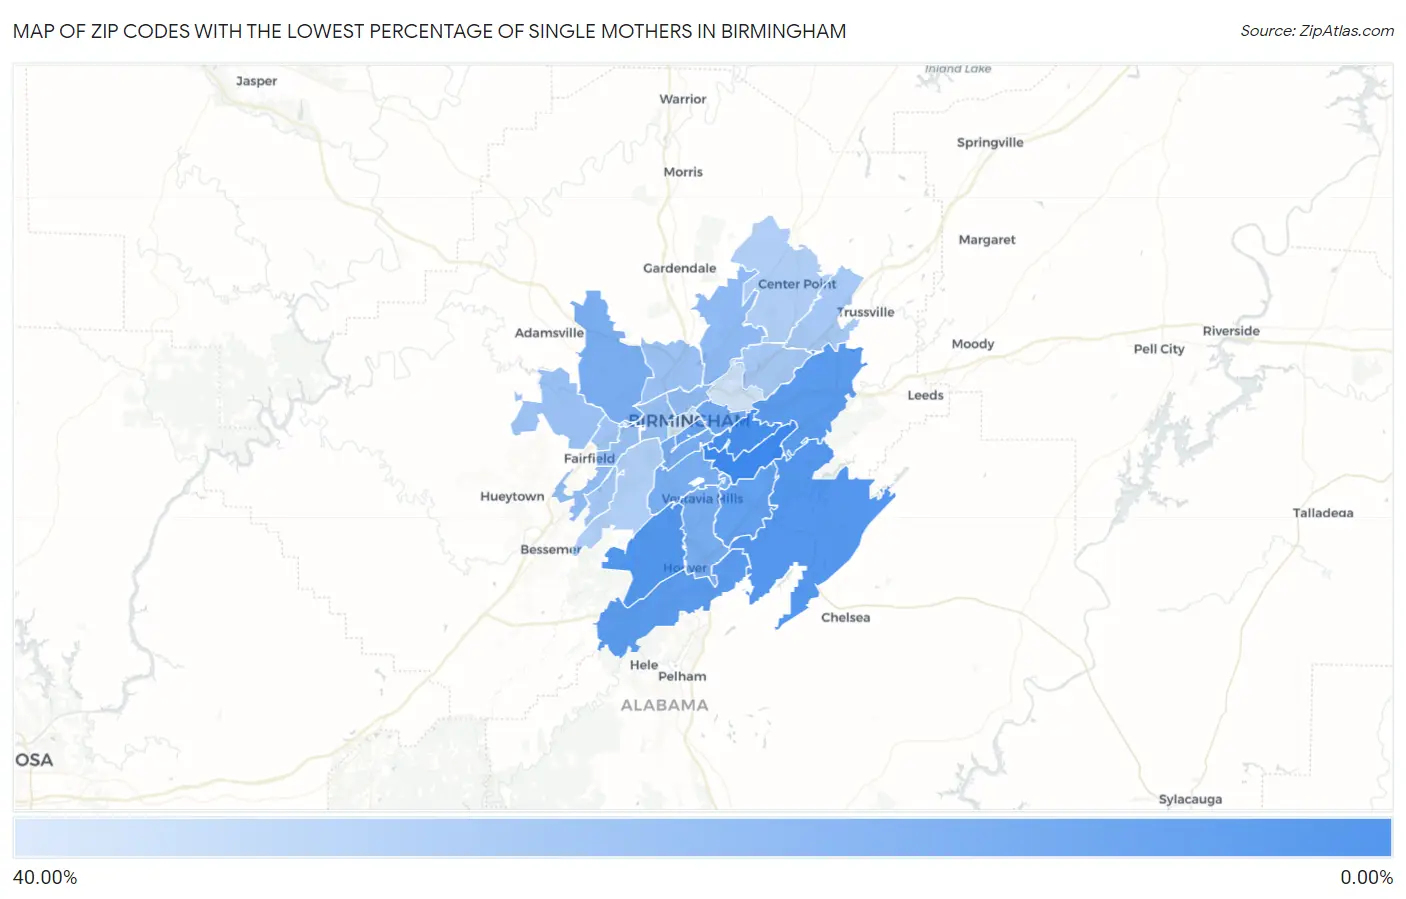
Zip Codes with the Lowest Percentage of Single Mothers in Birmingham, AL
RELATED REPORTS & OPTIONS
Fewest Single Mothers
Birmingham
Compare Zip Codes
Map of Zip Codes with the Lowest Percentage of Single Mothers in Birmingham
39.21%
0.37%
Zip Codes with the Lowest Percentage of Single Mothers in Birmingham, AL
| Zip Code | % Single Mothers | vs State | vs National | |
| 1. | 35223 | 0.37% | 13.00%(-12.6)#1 | 11.49%(-11.1)#40 |
| 2. | 35213 | 3.18% | 13.00%(-9.82)#30 | 11.49%(-8.31)#2,904 |
| 3. | 35226 | 5.77% | 13.00%(-7.23)#95 | 11.49%(-5.72)#7,624 |
| 4. | 35242 | 6.13% | 13.00%(-6.87)#111 | 11.49%(-5.35)#8,390 |
| 5. | 35244 | 7.50% | 13.00%(-5.50)#160 | 11.49%(-3.98)#11,181 |
| 6. | 35210 | 7.55% | 13.00%(-5.45)#163 | 11.49%(-3.94)#11,269 |
| 7. | 35243 | 9.33% | 13.00%(-3.67)#220 | 11.49%(-2.16)#14,565 |
| 8. | 35233 | 10.78% | 13.00%(-2.22)#273 | 11.49%(-0.711)#16,902 |
| 9. | 35222 | 12.71% | 13.00%(-0.285)#337 | 11.49%(+1.23)#19,471 |
| 10. | 35209 | 14.17% | 13.00%(+1.17)#369 | 11.49%(+2.68)#21,031 |
| 11. | 35216 | 14.17% | 13.00%(+1.17)#370 | 11.49%(+2.69)#21,035 |
| 12. | 35205 | 14.46% | 13.00%(+1.46)#375 | 11.49%(+2.97)#21,303 |
| 13. | 35214 | 15.21% | 13.00%(+2.21)#386 | 11.49%(+3.72)#21,893 |
| 14. | 35217 | 20.51% | 13.00%(+7.51)#457 | 11.49%(+9.02)#24,781 |
| 15. | 35234 | 20.90% | 13.00%(+7.90)#461 | 11.49%(+9.42)#24,920 |
| 16. | 35228 | 21.29% | 13.00%(+8.29)#467 | 11.49%(+9.80)#25,078 |
| 17. | 35204 | 22.47% | 13.00%(+9.47)#476 | 11.49%(+11.0)#25,445 |
| 18. | 35208 | 22.99% | 13.00%(+9.99)#483 | 11.49%(+11.5)#25,586 |
| 19. | 35224 | 23.50% | 13.00%(+10.5)#488 | 11.49%(+12.0)#25,708 |
| 20. | 35207 | 23.61% | 13.00%(+10.6)#490 | 11.49%(+12.1)#25,729 |
| 21. | 35218 | 25.28% | 13.00%(+12.3)#502 | 11.49%(+13.8)#26,078 |
| 22. | 35221 | 25.68% | 13.00%(+12.7)#508 | 11.49%(+14.2)#26,149 |
| 23. | 35206 | 26.78% | 13.00%(+13.8)#516 | 11.49%(+15.3)#26,318 |
| 24. | 35235 | 26.82% | 13.00%(+13.8)#517 | 11.49%(+15.3)#26,322 |
| 25. | 35215 | 28.88% | 13.00%(+15.9)#524 | 11.49%(+17.4)#26,600 |
| 26. | 35211 | 29.58% | 13.00%(+16.6)#526 | 11.49%(+18.1)#26,681 |
| 27. | 35203 | 38.04% | 13.00%(+25.0)#547 | 11.49%(+26.6)#27,309 |
| 28. | 35212 | 39.21% | 13.00%(+26.2)#548 | 11.49%(+27.7)#27,351 |
1
Common Questions
What are the Top 10 Zip Codes with the Lowest Percentage of Single Mothers in Birmingham, AL?
Top 10 Zip Codes with the Lowest Percentage of Single Mothers in Birmingham, AL are:
What zip code has the Lowest Percentage of Single Mothers in Birmingham, AL?
35223 has the Lowest Percentage of Single Mothers in Birmingham, AL with 0.37%.
What is the Percentage of Single Mothers in Birmingham, AL?
Percentage of Single Mothers in Birmingham is 24.23%.
What is the Percentage of Single Mothers in Alabama?
Percentage of Single Mothers in Alabama is 13.00%.
What is the Percentage of Single Mothers in the United States?
Percentage of Single Mothers in the United States is 11.49%.