Zip Codes with the Highest Percentage of Population with a Degree in Social Sciences in Birmingham, AL
RELATED REPORTS & OPTIONS
Social Sciences
Birmingham
Compare Zip Codes
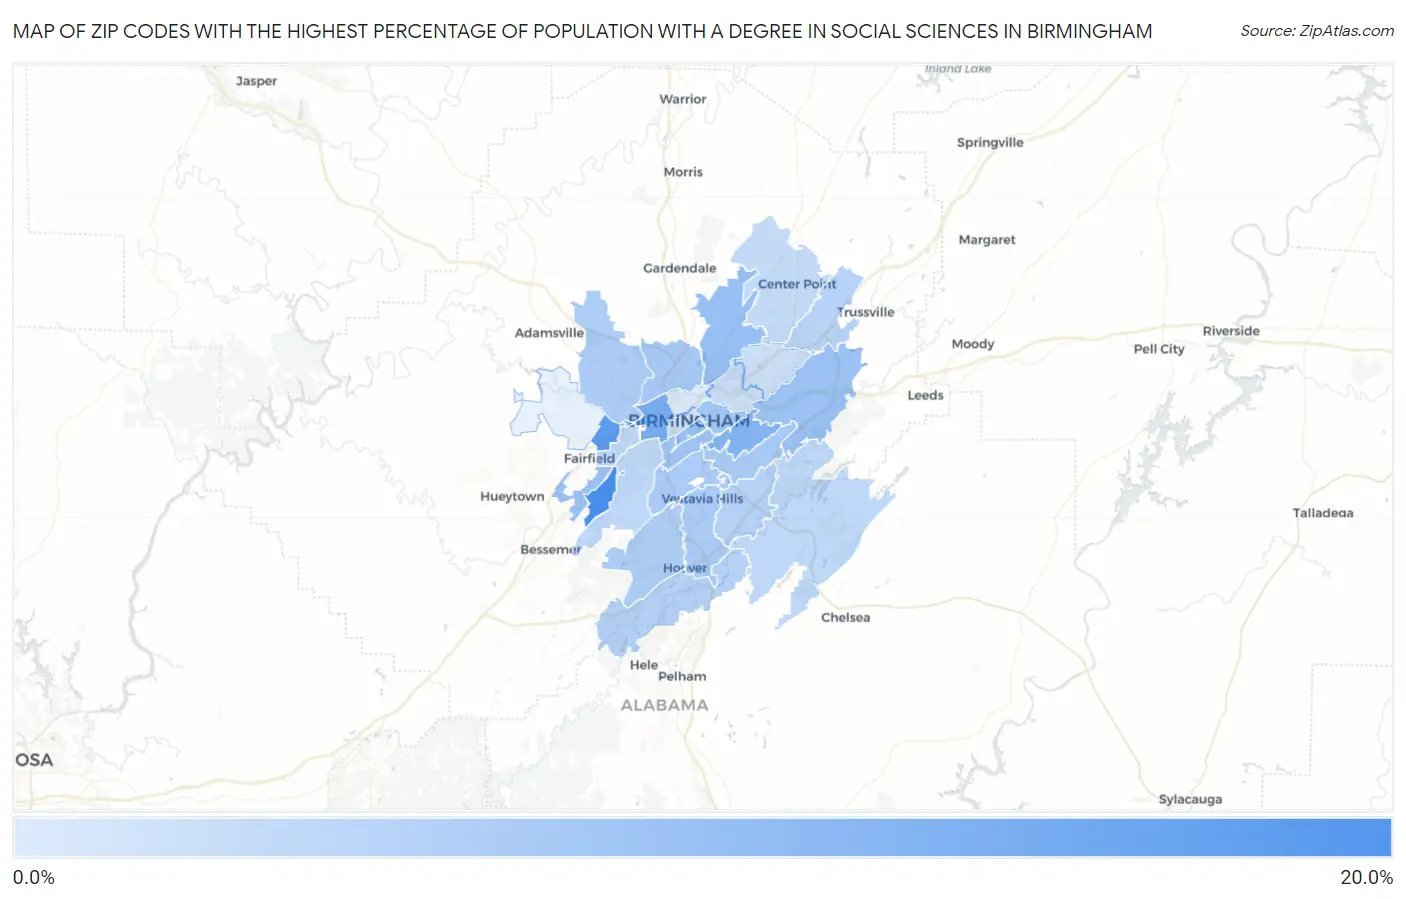
Map of Zip Codes with the Highest Percentage of Population with a Degree in Social Sciences in Birmingham
1.5%
15.6%
Zip Codes with the Highest Percentage of Population with a Degree in Social Sciences in Birmingham, AL
| Zip Code | % Graduates | vs State | vs National | |
| 1. | 35221 | 15.6% | 4.7%(+10.9)#18 | 8.1%(+7.56)#1,751 |
| 2. | 35218 | 13.4% | 4.7%(+8.69)#25 | 8.1%(+5.37)#2,617 |
| 3. | 35204 | 10.6% | 4.7%(+5.85)#39 | 8.1%(+2.53)#4,815 |
| 4. | 35213 | 9.6% | 4.7%(+4.86)#45 | 8.1%(+1.53)#6,063 |
| 5. | 35233 | 7.8% | 4.7%(+3.06)#69 | 8.1%(-0.271)#9,167 |
| 6. | 35217 | 7.7% | 4.7%(+2.97)#71 | 8.1%(-0.356)#9,337 |
| 7. | 35210 | 7.6% | 4.7%(+2.83)#74 | 8.1%(-0.493)#9,610 |
| 8. | 35228 | 7.2% | 4.7%(+2.46)#80 | 8.1%(-0.869)#10,433 |
| 9. | 35205 | 6.9% | 4.7%(+2.19)#90 | 8.1%(-1.13)#11,055 |
| 10. | 35222 | 6.8% | 4.7%(+2.09)#95 | 8.1%(-1.24)#11,308 |
| 11. | 35207 | 6.6% | 4.7%(+1.88)#105 | 8.1%(-1.45)#11,794 |
| 12. | 35223 | 6.2% | 4.7%(+1.50)#124 | 8.1%(-1.83)#12,784 |
| 13. | 35216 | 6.1% | 4.7%(+1.39)#128 | 8.1%(-1.94)#12,999 |
| 14. | 35209 | 6.1% | 4.7%(+1.32)#131 | 8.1%(-2.01)#13,178 |
| 15. | 35214 | 5.9% | 4.7%(+1.18)#137 | 8.1%(-2.15)#13,526 |
| 16. | 35226 | 5.7% | 4.7%(+0.934)#152 | 8.1%(-2.39)#14,125 |
| 17. | 35243 | 5.1% | 4.7%(+0.349)#181 | 8.1%(-2.98)#15,607 |
| 18. | 35244 | 5.0% | 4.7%(+0.267)#186 | 8.1%(-3.06)#15,793 |
| 19. | 35235 | 4.9% | 4.7%(+0.136)#190 | 8.1%(-3.19)#16,106 |
| 20. | 35242 | 4.3% | 4.7%(-0.487)#227 | 8.1%(-3.81)#17,608 |
| 21. | 35211 | 4.3% | 4.7%(-0.487)#228 | 8.1%(-3.81)#17,611 |
| 22. | 35208 | 4.2% | 4.7%(-0.532)#232 | 8.1%(-3.86)#17,718 |
| 23. | 35215 | 3.8% | 4.7%(-0.920)#254 | 8.1%(-4.25)#18,605 |
| 24. | 35203 | 3.2% | 4.7%(-1.56)#287 | 8.1%(-4.88)#19,959 |
| 25. | 35212 | 3.1% | 4.7%(-1.68)#295 | 8.1%(-5.00)#20,212 |
| 26. | 35206 | 3.0% | 4.7%(-1.70)#298 | 8.1%(-5.03)#20,254 |
| 27. | 35234 | 1.5% | 4.7%(-3.22)#386 | 8.1%(-6.54)#22,929 |
1
Common Questions
What are the Top 10 Zip Codes with the Highest Percentage of Population with a Degree in Social Sciences in Birmingham, AL?
Top 10 Zip Codes with the Highest Percentage of Population with a Degree in Social Sciences in Birmingham, AL are:
What zip code has the Highest Percentage of Population with a Degree in Social Sciences in Birmingham, AL?
35221 has the Highest Percentage of Population with a Degree in Social Sciences in Birmingham, AL with 15.6%.
What is the Percentage of Population with a Degree in Social Sciences in Birmingham, AL?
Percentage of Population with a Degree in Social Sciences in Birmingham is 6.0%.
What is the Percentage of Population with a Degree in Social Sciences in Alabama?
Percentage of Population with a Degree in Social Sciences in Alabama is 4.7%.
What is the Percentage of Population with a Degree in Social Sciences in the United States?
Percentage of Population with a Degree in Social Sciences in the United States is 8.1%.