Zip Codes with the Highest Percentage of Population Employed in Office & Administration in Birmingham, AL
RELATED REPORTS & OPTIONS
Office & Administration
Birmingham
Compare Zip Codes
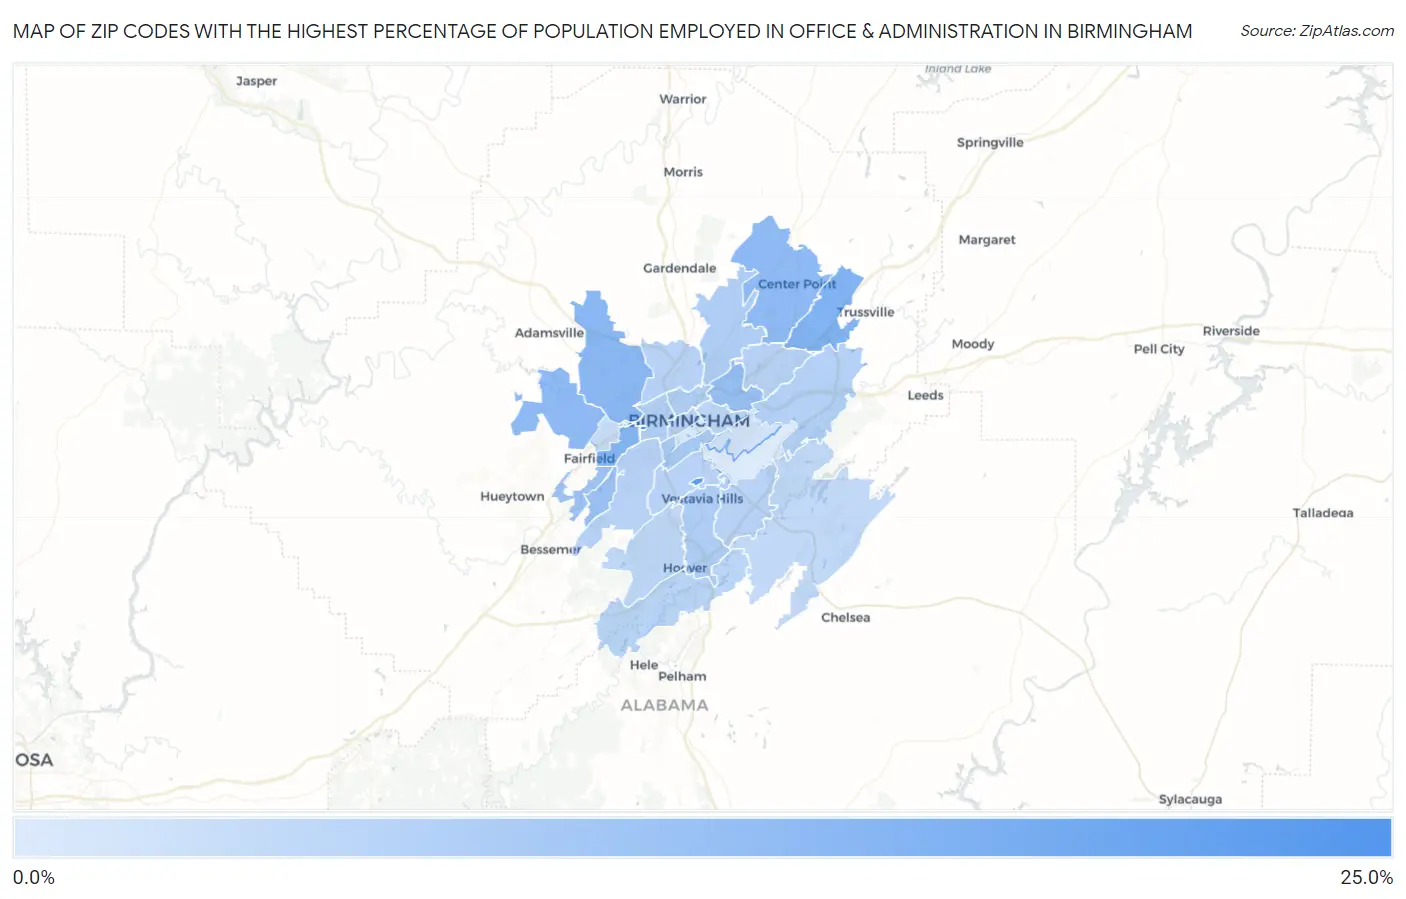
Map of Zip Codes with the Highest Percentage of Population Employed in Office & Administration in Birmingham
4.6%
24.5%
Zip Codes with the Highest Percentage of Population Employed in Office & Administration in Birmingham, AL
| Zip Code | % Employed | vs State | vs National | |
| 1. | 35254 | 24.5% | 10.7%(+13.8)#18 | 10.9%(+13.6)#969 |
| 2. | 35229 | 21.4% | 10.7%(+10.7)#27 | 10.9%(+10.5)#1,417 |
| 3. | 35235 | 16.4% | 10.7%(+5.72)#69 | 10.9%(+5.58)#3,228 |
| 4. | 35208 | 15.8% | 10.7%(+5.09)#76 | 10.9%(+4.95)#3,725 |
| 5. | 35214 | 15.1% | 10.7%(+4.41)#86 | 10.9%(+4.27)#4,416 |
| 6. | 35215 | 14.7% | 10.7%(+3.95)#96 | 10.9%(+3.81)#5,029 |
| 7. | 35224 | 14.5% | 10.7%(+3.81)#99 | 10.9%(+3.67)#5,217 |
| 8. | 35212 | 13.2% | 10.7%(+2.52)#146 | 10.9%(+2.38)#7,516 |
| 9. | 35221 | 12.9% | 10.7%(+2.22)#155 | 10.9%(+2.08)#8,198 |
| 10. | 35228 | 12.3% | 10.7%(+1.54)#189 | 10.9%(+1.40)#9,971 |
| 11. | 35205 | 11.3% | 10.7%(+0.585)#236 | 10.9%(+0.446)#12,878 |
| 12. | 35217 | 10.4% | 10.7%(-0.338)#284 | 10.9%(-0.477)#15,898 |
| 13. | 35216 | 10.2% | 10.7%(-0.505)#294 | 10.9%(-0.644)#16,445 |
| 14. | 35234 | 10.2% | 10.7%(-0.563)#297 | 10.9%(-0.702)#16,622 |
| 15. | 35204 | 9.8% | 10.7%(-0.918)#314 | 10.9%(-1.06)#17,763 |
| 16. | 35210 | 9.7% | 10.7%(-1.04)#319 | 10.9%(-1.18)#18,151 |
| 17. | 35203 | 9.3% | 10.7%(-1.43)#345 | 10.9%(-1.57)#19,419 |
| 18. | 35209 | 9.2% | 10.7%(-1.54)#351 | 10.9%(-1.68)#19,728 |
| 19. | 35206 | 9.1% | 10.7%(-1.59)#353 | 10.9%(-1.73)#19,847 |
| 20. | 35211 | 9.1% | 10.7%(-1.60)#356 | 10.9%(-1.74)#19,887 |
| 21. | 35207 | 9.1% | 10.7%(-1.63)#361 | 10.9%(-1.77)#19,969 |
| 22. | 35243 | 9.0% | 10.7%(-1.68)#365 | 10.9%(-1.82)#20,159 |
| 23. | 35244 | 9.0% | 10.7%(-1.75)#372 | 10.9%(-1.89)#20,344 |
| 24. | 35222 | 8.7% | 10.7%(-2.05)#386 | 10.9%(-2.19)#21,254 |
| 25. | 35226 | 8.2% | 10.7%(-2.48)#419 | 10.9%(-2.62)#22,404 |
| 26. | 35242 | 8.0% | 10.7%(-2.67)#430 | 10.9%(-2.81)#22,926 |
| 27. | 35218 | 7.1% | 10.7%(-3.59)#470 | 10.9%(-3.73)#24,982 |
| 28. | 35213 | 5.9% | 10.7%(-4.82)#506 | 10.9%(-4.96)#26,989 |
| 29. | 35233 | 5.4% | 10.7%(-5.28)#520 | 10.9%(-5.42)#27,614 |
| 30. | 35223 | 4.6% | 10.7%(-6.15)#542 | 10.9%(-6.29)#28,511 |
1
Common Questions
What are the Top 10 Zip Codes with the Highest Percentage of Population Employed in Office & Administration in Birmingham, AL?
Top 10 Zip Codes with the Highest Percentage of Population Employed in Office & Administration in Birmingham, AL are:
What zip code has the Highest Percentage of Population Employed in Office & Administration in Birmingham, AL?
35254 has the Highest Percentage of Population Employed in Office & Administration in Birmingham, AL with 24.5%.
What is the Percentage of Population Employed in Office & Administration in Birmingham, AL?
Percentage of Population Employed in Office & Administration in Birmingham is 11.3%.
What is the Percentage of Population Employed in Office & Administration in Alabama?
Percentage of Population Employed in Office & Administration in Alabama is 10.7%.
What is the Percentage of Population Employed in Office & Administration in the United States?
Percentage of Population Employed in Office & Administration in the United States is 10.9%.