Zip Codes with the Highest Percentage of Population Employed in Computer, Engineering & Science in Birmingham, AL
RELATED REPORTS & OPTIONS
Computer, Engineering & Science
Birmingham
Compare Zip Codes
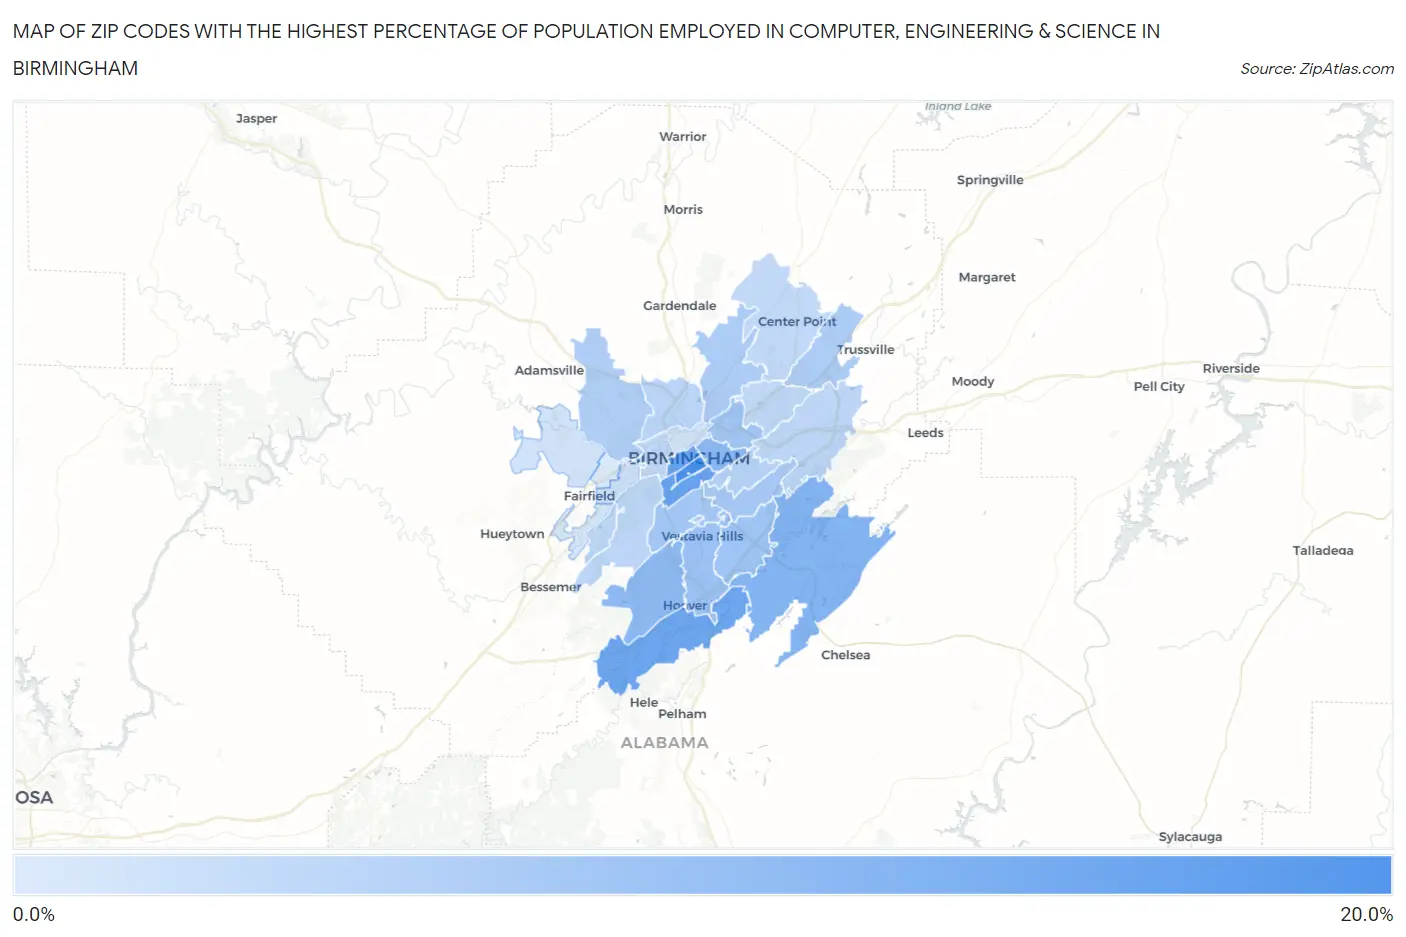
Map of Zip Codes with the Highest Percentage of Population Employed in Computer, Engineering & Science in Birmingham
0.46%
15.1%
Zip Codes with the Highest Percentage of Population Employed in Computer, Engineering & Science in Birmingham, AL
| Zip Code | % Employed | vs State | vs National | |
| 1. | 35233 | 15.1% | 5.7%(+9.42)#26 | 6.8%(+8.35)#1,104 |
| 2. | 35205 | 11.9% | 5.7%(+6.20)#38 | 6.8%(+5.13)#2,087 |
| 3. | 35203 | 11.6% | 5.7%(+5.87)#42 | 6.8%(+4.80)#2,261 |
| 4. | 35244 | 11.0% | 5.7%(+5.28)#46 | 6.8%(+4.21)#2,590 |
| 5. | 35242 | 9.1% | 5.7%(+3.36)#70 | 6.8%(+2.29)#4,013 |
| 6. | 35222 | 8.4% | 5.7%(+2.71)#76 | 6.8%(+1.64)#4,710 |
| 7. | 35226 | 8.0% | 5.7%(+2.27)#83 | 6.8%(+1.20)#5,316 |
| 8. | 35216 | 6.8% | 5.7%(+1.12)#95 | 6.8%(+0.045)#7,134 |
| 9. | 35243 | 6.3% | 5.7%(+0.601)#111 | 6.8%(-0.471)#8,139 |
| 10. | 35212 | 5.9% | 5.7%(+0.237)#127 | 6.8%(-0.835)#8,995 |
| 11. | 35209 | 5.9% | 5.7%(+0.181)#129 | 6.8%(-0.891)#9,138 |
| 12. | 35223 | 5.7% | 5.7%(+0.049)#134 | 6.8%(-1.02)#9,446 |
| 13. | 35217 | 5.0% | 5.7%(-0.648)#159 | 6.8%(-1.72)#11,243 |
| 14. | 35235 | 4.9% | 5.7%(-0.748)#168 | 6.8%(-1.82)#11,537 |
| 15. | 35214 | 4.7% | 5.7%(-1.04)#185 | 6.8%(-2.11)#12,343 |
| 16. | 35229 | 4.6% | 5.7%(-1.08)#187 | 6.8%(-2.16)#12,465 |
| 17. | 35213 | 4.2% | 5.7%(-1.52)#217 | 6.8%(-2.59)#13,933 |
| 18. | 35207 | 3.6% | 5.7%(-2.14)#268 | 6.8%(-3.21)#16,044 |
| 19. | 35221 | 3.5% | 5.7%(-2.16)#270 | 6.8%(-3.24)#16,141 |
| 20. | 35210 | 3.5% | 5.7%(-2.21)#274 | 6.8%(-3.28)#16,332 |
| 21. | 35211 | 3.4% | 5.7%(-2.26)#280 | 6.8%(-3.33)#16,519 |
| 22. | 35254 | 3.3% | 5.7%(-2.35)#286 | 6.8%(-3.42)#16,823 |
| 23. | 35215 | 3.1% | 5.7%(-2.59)#307 | 6.8%(-3.66)#17,745 |
| 24. | 35206 | 3.0% | 5.7%(-2.70)#314 | 6.8%(-3.77)#18,123 |
| 25. | 35204 | 2.9% | 5.7%(-2.77)#320 | 6.8%(-3.84)#18,384 |
| 26. | 35208 | 2.0% | 5.7%(-3.68)#403 | 6.8%(-4.75)#21,819 |
| 27. | 35224 | 1.5% | 5.7%(-4.15)#444 | 6.8%(-5.22)#23,467 |
| 28. | 35234 | 1.5% | 5.7%(-4.22)#451 | 6.8%(-5.29)#23,683 |
| 29. | 35228 | 0.97% | 5.7%(-4.72)#481 | 6.8%(-5.79)#25,119 |
| 30. | 35218 | 0.46% | 5.7%(-5.24)#513 | 6.8%(-6.31)#26,284 |
1
Common Questions
What are the Top 10 Zip Codes with the Highest Percentage of Population Employed in Computer, Engineering & Science in Birmingham, AL?
Top 10 Zip Codes with the Highest Percentage of Population Employed in Computer, Engineering & Science in Birmingham, AL are:
What zip code has the Highest Percentage of Population Employed in Computer, Engineering & Science in Birmingham, AL?
35233 has the Highest Percentage of Population Employed in Computer, Engineering & Science in Birmingham, AL with 15.1%.
What is the Percentage of Population Employed in Computer, Engineering & Science in Birmingham, AL?
Percentage of Population Employed in Computer, Engineering & Science in Birmingham is 5.5%.
What is the Percentage of Population Employed in Computer, Engineering & Science in Alabama?
Percentage of Population Employed in Computer, Engineering & Science in Alabama is 5.7%.
What is the Percentage of Population Employed in Computer, Engineering & Science in the United States?
Percentage of Population Employed in Computer, Engineering & Science in the United States is 6.8%.