Zip Codes with the Highest Percentage of Population with a Degree in Engineering in Birmingham, AL
RELATED REPORTS & OPTIONS
Engineering
Birmingham
Compare Zip Codes
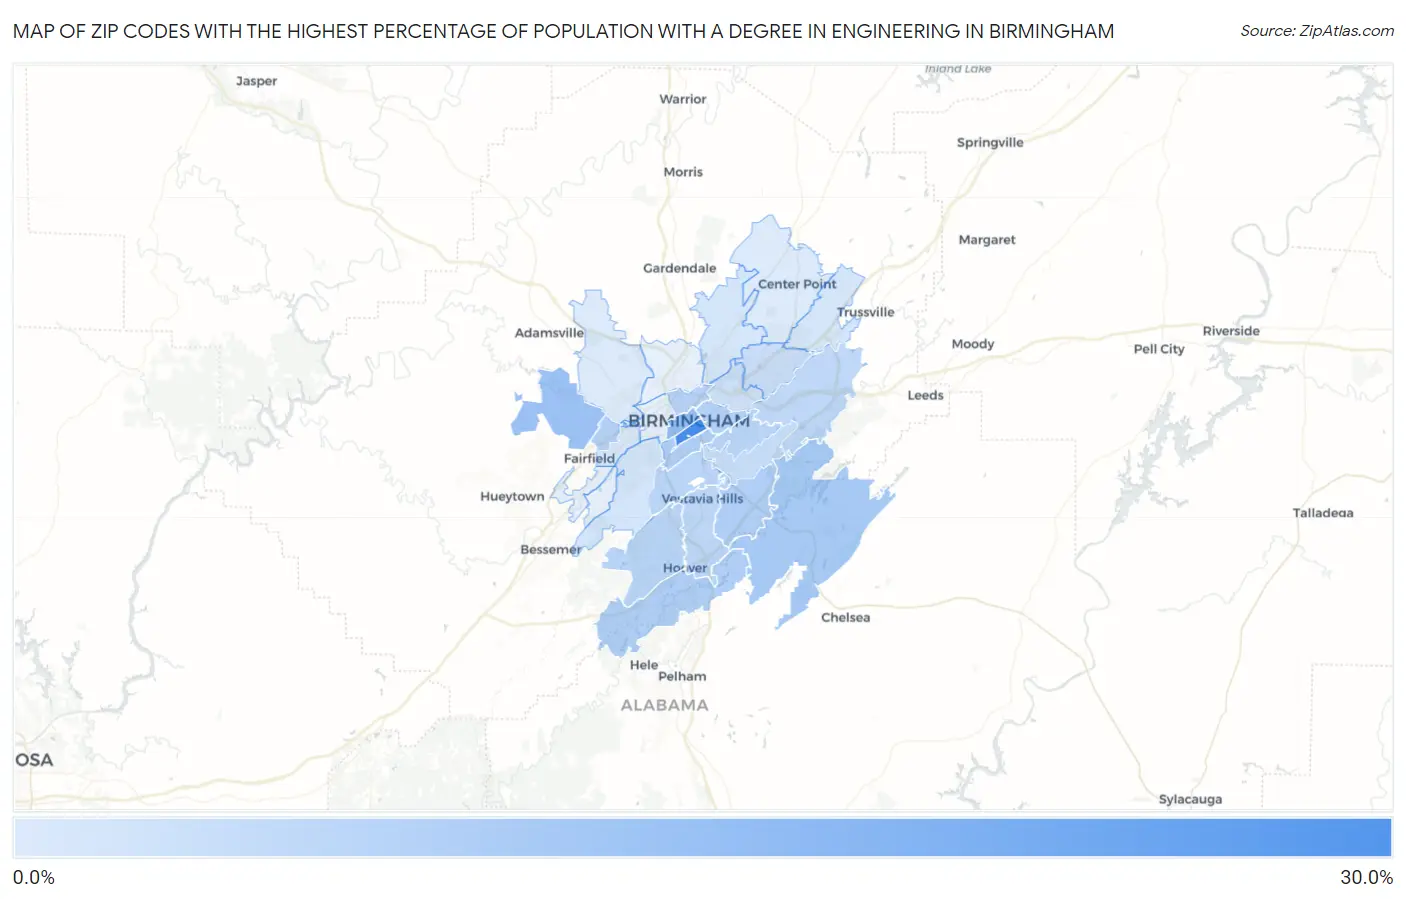
Map of Zip Codes with the Highest Percentage of Population with a Degree in Engineering in Birmingham
0.86%
25.9%
Zip Codes with the Highest Percentage of Population with a Degree in Engineering in Birmingham, AL
| Zip Code | % Graduates | vs State | vs National | |
| 1. | 35233 | 25.9% | 7.7%(+18.2)#12 | 7.6%(+18.2)#507 |
| 2. | 35203 | 11.9% | 7.7%(+4.23)#84 | 7.6%(+4.29)#2,926 |
| 3. | 35224 | 10.9% | 7.7%(+3.16)#96 | 7.6%(+3.21)#3,651 |
| 4. | 35242 | 9.1% | 7.7%(+1.37)#126 | 7.6%(+1.42)#5,500 |
| 5. | 35205 | 7.9% | 7.7%(+0.150)#159 | 7.6%(+0.203)#7,366 |
| 6. | 35244 | 7.7% | 7.7%(+0.025)#162 | 7.6%(+0.078)#7,581 |
| 7. | 35243 | 7.7% | 7.7%(+0.024)#163 | 7.6%(+0.077)#7,586 |
| 8. | 35218 | 7.1% | 7.7%(-0.639)#183 | 7.6%(-0.586)#8,861 |
| 9. | 35222 | 7.0% | 7.7%(-0.725)#186 | 7.6%(-0.672)#9,037 |
| 10. | 35234 | 6.4% | 7.7%(-1.28)#204 | 7.6%(-1.23)#10,168 |
| 11. | 35226 | 6.3% | 7.7%(-1.41)#207 | 7.6%(-1.36)#10,491 |
| 12. | 35213 | 6.0% | 7.7%(-1.68)#217 | 7.6%(-1.62)#11,119 |
| 13. | 35209 | 6.0% | 7.7%(-1.72)#219 | 7.6%(-1.67)#11,243 |
| 14. | 35216 | 5.8% | 7.7%(-1.88)#226 | 7.6%(-1.82)#11,629 |
| 15. | 35210 | 5.6% | 7.7%(-2.13)#233 | 7.6%(-2.08)#12,275 |
| 16. | 35223 | 4.4% | 7.7%(-3.26)#292 | 7.6%(-3.21)#15,220 |
| 17. | 35206 | 3.6% | 7.7%(-4.12)#327 | 7.6%(-4.07)#17,454 |
| 18. | 35212 | 3.1% | 7.7%(-4.59)#343 | 7.6%(-4.53)#18,613 |
| 19. | 35211 | 2.2% | 7.7%(-5.48)#391 | 7.6%(-5.42)#20,522 |
| 20. | 35235 | 1.8% | 7.7%(-5.88)#410 | 7.6%(-5.82)#21,297 |
| 21. | 35217 | 1.8% | 7.7%(-5.90)#411 | 7.6%(-5.84)#21,337 |
| 22. | 35208 | 1.4% | 7.7%(-6.30)#427 | 7.6%(-6.24)#21,999 |
| 23. | 35215 | 0.92% | 7.7%(-6.78)#441 | 7.6%(-6.73)#22,743 |
| 24. | 35214 | 0.86% | 7.7%(-6.84)#444 | 7.6%(-6.78)#22,799 |
1
Common Questions
What are the Top 10 Zip Codes with the Highest Percentage of Population with a Degree in Engineering in Birmingham, AL?
Top 10 Zip Codes with the Highest Percentage of Population with a Degree in Engineering in Birmingham, AL are:
What zip code has the Highest Percentage of Population with a Degree in Engineering in Birmingham, AL?
35233 has the Highest Percentage of Population with a Degree in Engineering in Birmingham, AL with 25.9%.
What is the Percentage of Population with a Degree in Engineering in Birmingham, AL?
Percentage of Population with a Degree in Engineering in Birmingham is 5.2%.
What is the Percentage of Population with a Degree in Engineering in Alabama?
Percentage of Population with a Degree in Engineering in Alabama is 7.7%.
What is the Percentage of Population with a Degree in Engineering in the United States?
Percentage of Population with a Degree in Engineering in the United States is 7.6%.