Zip Codes with the Highest Percentage of Population Employed in Accommodation & Food Services in Birmingham, AL
RELATED REPORTS & OPTIONS
Accommodation & Food Services
Birmingham
Compare Zip Codes
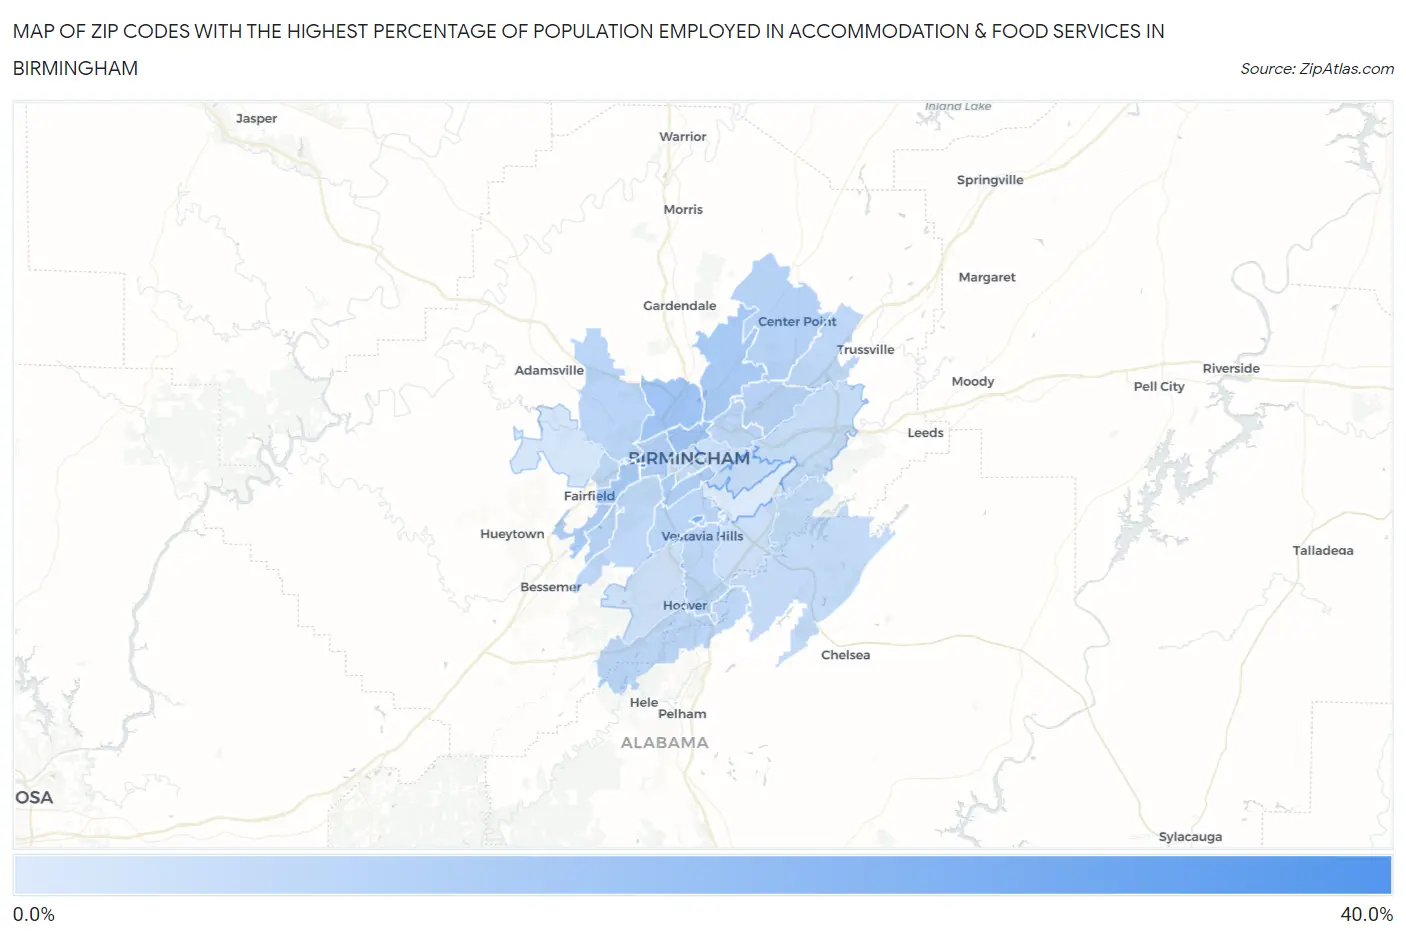
Map of Zip Codes with the Highest Percentage of Population Employed in Accommodation & Food Services in Birmingham
1.3%
31.8%
Zip Codes with the Highest Percentage of Population Employed in Accommodation & Food Services in Birmingham, AL
| Zip Code | % Employed | vs State | vs National | |
| 1. | 35254 | 31.8% | 6.9%(+24.9)#2 | 6.9%(+24.9)#285 |
| 2. | 35229 | 20.6% | 6.9%(+13.7)#10 | 6.9%(+13.7)#771 |
| 3. | 35234 | 12.7% | 6.9%(+5.84)#48 | 6.9%(+5.85)#2,467 |
| 4. | 35207 | 12.5% | 6.9%(+5.58)#54 | 6.9%(+5.59)#2,606 |
| 5. | 35217 | 11.4% | 6.9%(+4.52)#65 | 6.9%(+4.54)#3,215 |
| 6. | 35208 | 11.3% | 6.9%(+4.43)#68 | 6.9%(+4.44)#3,304 |
| 7. | 35228 | 10.1% | 6.9%(+3.16)#88 | 6.9%(+3.18)#4,455 |
| 8. | 35205 | 9.8% | 6.9%(+2.87)#92 | 6.9%(+2.89)#4,833 |
| 9. | 35204 | 9.1% | 6.9%(+2.24)#110 | 6.9%(+2.25)#5,754 |
| 10. | 35215 | 8.5% | 6.9%(+1.62)#136 | 6.9%(+1.64)#6,795 |
| 11. | 35206 | 8.2% | 6.9%(+1.30)#148 | 6.9%(+1.31)#7,428 |
| 12. | 35221 | 8.0% | 6.9%(+1.13)#154 | 6.9%(+1.14)#7,777 |
| 13. | 35209 | 7.8% | 6.9%(+0.895)#166 | 6.9%(+0.909)#8,284 |
| 14. | 35214 | 7.5% | 6.9%(+0.623)#179 | 6.9%(+0.637)#8,955 |
| 15. | 35244 | 7.3% | 6.9%(+0.357)#200 | 6.9%(+0.370)#9,672 |
| 16. | 35235 | 7.2% | 6.9%(+0.328)#202 | 6.9%(+0.342)#9,743 |
| 17. | 35218 | 7.0% | 6.9%(+0.151)#214 | 6.9%(+0.164)#10,189 |
| 18. | 35216 | 7.0% | 6.9%(+0.133)#217 | 6.9%(+0.146)#10,235 |
| 19. | 35211 | 6.9% | 6.9%(-0.012)#222 | 6.9%(+0.002)#10,632 |
| 20. | 35212 | 6.8% | 6.9%(-0.114)#231 | 6.9%(-0.101)#10,949 |
| 21. | 35233 | 6.0% | 6.9%(-0.909)#273 | 6.9%(-0.896)#13,492 |
| 22. | 35242 | 5.7% | 6.9%(-1.15)#290 | 6.9%(-1.14)#14,255 |
| 23. | 35213 | 5.7% | 6.9%(-1.19)#296 | 6.9%(-1.18)#14,396 |
| 24. | 35210 | 5.3% | 6.9%(-1.59)#315 | 6.9%(-1.58)#15,765 |
| 25. | 35222 | 4.2% | 6.9%(-2.73)#387 | 6.9%(-2.71)#19,604 |
| 26. | 35243 | 4.0% | 6.9%(-2.87)#393 | 6.9%(-2.86)#20,085 |
| 27. | 35203 | 3.9% | 6.9%(-2.99)#401 | 6.9%(-2.97)#20,451 |
| 28. | 35226 | 3.7% | 6.9%(-3.18)#415 | 6.9%(-3.16)#21,049 |
| 29. | 35224 | 2.6% | 6.9%(-4.28)#474 | 6.9%(-4.26)#24,203 |
| 30. | 35223 | 1.3% | 6.9%(-5.58)#520 | 6.9%(-5.57)#26,796 |
1
Common Questions
What are the Top 10 Zip Codes with the Highest Percentage of Population Employed in Accommodation & Food Services in Birmingham, AL?
Top 10 Zip Codes with the Highest Percentage of Population Employed in Accommodation & Food Services in Birmingham, AL are:
What zip code has the Highest Percentage of Population Employed in Accommodation & Food Services in Birmingham, AL?
35254 has the Highest Percentage of Population Employed in Accommodation & Food Services in Birmingham, AL with 31.8%.
What is the Percentage of Population Employed in Accommodation & Food Services in Birmingham, AL?
Percentage of Population Employed in Accommodation & Food Services in Birmingham is 7.8%.
What is the Percentage of Population Employed in Accommodation & Food Services in Alabama?
Percentage of Population Employed in Accommodation & Food Services in Alabama is 6.9%.
What is the Percentage of Population Employed in Accommodation & Food Services in the United States?
Percentage of Population Employed in Accommodation & Food Services in the United States is 6.9%.