Zip Codes with the Highest Percentage of Population with a Degree in Computers and Mathematics in Birmingham, AL
RELATED REPORTS & OPTIONS
Computers and Mathematics
Birmingham
Compare Zip Codes
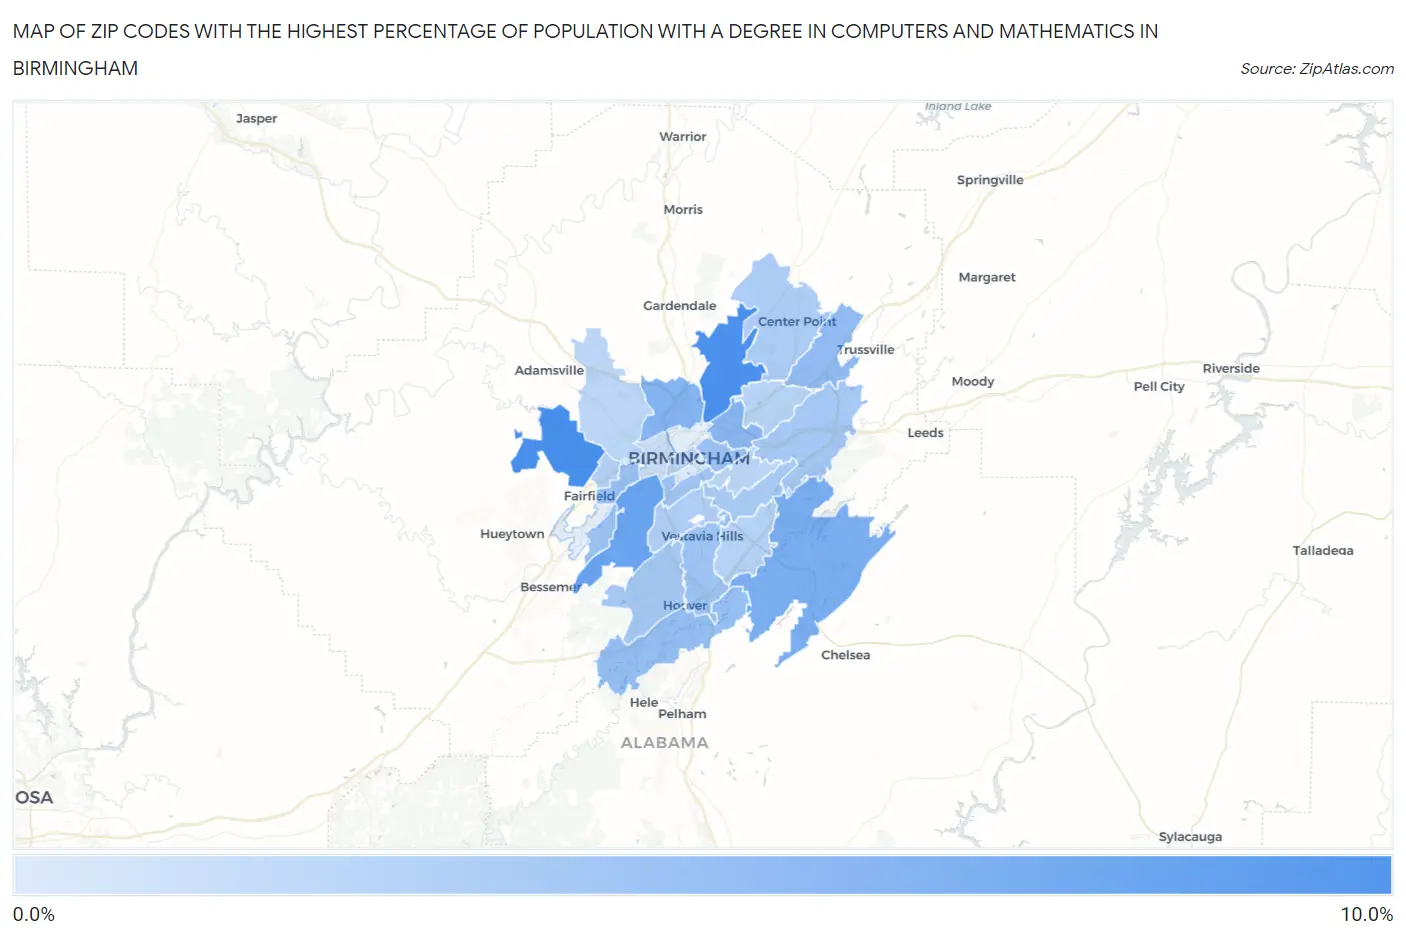
Map of Zip Codes with the Highest Percentage of Population with a Degree in Computers and Mathematics in Birmingham
0.38%
9.1%
Zip Codes with the Highest Percentage of Population with a Degree in Computers and Mathematics in Birmingham, AL
| Zip Code | % Graduates | vs State | vs National | |
| 1. | 35224 | 9.1% | 4.4%(+4.76)#50 | 4.9%(+4.25)#2,156 |
| 2. | 35217 | 9.0% | 4.4%(+4.64)#52 | 4.9%(+4.12)#2,244 |
| 3. | 35211 | 7.1% | 4.4%(+2.69)#88 | 4.9%(+2.18)#3,751 |
| 4. | 35242 | 6.1% | 4.4%(+1.69)#102 | 4.9%(+1.18)#5,171 |
| 5. | 35207 | 5.5% | 4.4%(+1.17)#123 | 4.9%(+0.653)#6,210 |
| 6. | 35212 | 5.2% | 4.4%(+0.810)#137 | 4.9%(+0.294)#7,013 |
| 7. | 35235 | 4.8% | 4.4%(+0.409)#148 | 4.9%(-0.107)#8,025 |
| 8. | 35244 | 4.4% | 4.4%(+0.064)#165 | 4.9%(-0.452)#9,057 |
| 9. | 35208 | 4.4% | 4.4%(+0.011)#167 | 4.9%(-0.505)#9,236 |
| 10. | 35221 | 4.2% | 4.4%(-0.143)#174 | 4.9%(-0.659)#9,726 |
| 11. | 35222 | 4.0% | 4.4%(-0.368)#181 | 4.9%(-0.884)#10,430 |
| 12. | 35216 | 3.9% | 4.4%(-0.483)#187 | 4.9%(-0.999)#10,823 |
| 13. | 35205 | 3.9% | 4.4%(-0.526)#191 | 4.9%(-1.04)#10,976 |
| 14. | 35210 | 3.6% | 4.4%(-0.819)#210 | 4.9%(-1.34)#12,060 |
| 15. | 35226 | 3.5% | 4.4%(-0.874)#215 | 4.9%(-1.39)#12,283 |
| 16. | 35223 | 3.4% | 4.4%(-1.01)#220 | 4.9%(-1.52)#12,744 |
| 17. | 35215 | 3.1% | 4.4%(-1.31)#235 | 4.9%(-1.83)#13,843 |
| 18. | 35209 | 3.0% | 4.4%(-1.38)#246 | 4.9%(-1.89)#14,095 |
| 19. | 35218 | 2.7% | 4.4%(-1.64)#264 | 4.9%(-2.16)#15,043 |
| 20. | 35243 | 2.7% | 4.4%(-1.71)#271 | 4.9%(-2.23)#15,277 |
| 21. | 35206 | 2.4% | 4.4%(-2.01)#289 | 4.9%(-2.53)#16,373 |
| 22. | 35203 | 2.3% | 4.4%(-2.11)#295 | 4.9%(-2.63)#16,730 |
| 23. | 35214 | 2.2% | 4.4%(-2.18)#298 | 4.9%(-2.70)#16,982 |
| 24. | 35213 | 2.2% | 4.4%(-2.22)#300 | 4.9%(-2.74)#17,107 |
| 25. | 35204 | 1.4% | 4.4%(-3.03)#346 | 4.9%(-3.54)#19,551 |
| 26. | 35233 | 0.38% | 4.4%(-3.99)#400 | 4.9%(-4.51)#21,630 |
1
Common Questions
What are the Top 10 Zip Codes with the Highest Percentage of Population with a Degree in Computers and Mathematics in Birmingham, AL?
Top 10 Zip Codes with the Highest Percentage of Population with a Degree in Computers and Mathematics in Birmingham, AL are:
What zip code has the Highest Percentage of Population with a Degree in Computers and Mathematics in Birmingham, AL?
35224 has the Highest Percentage of Population with a Degree in Computers and Mathematics in Birmingham, AL with 9.1%.
What is the Percentage of Population with a Degree in Computers and Mathematics in Birmingham, AL?
Percentage of Population with a Degree in Computers and Mathematics in Birmingham is 3.4%.
What is the Percentage of Population with a Degree in Computers and Mathematics in Alabama?
Percentage of Population with a Degree in Computers and Mathematics in Alabama is 4.4%.
What is the Percentage of Population with a Degree in Computers and Mathematics in the United States?
Percentage of Population with a Degree in Computers and Mathematics in the United States is 4.9%.