Zip Codes with the Highest Percentage of Households with Income Below $10,000 in Anniston, AL
RELATED REPORTS & OPTIONS
Household Income | $0-10k
Anniston
Compare Zip Codes
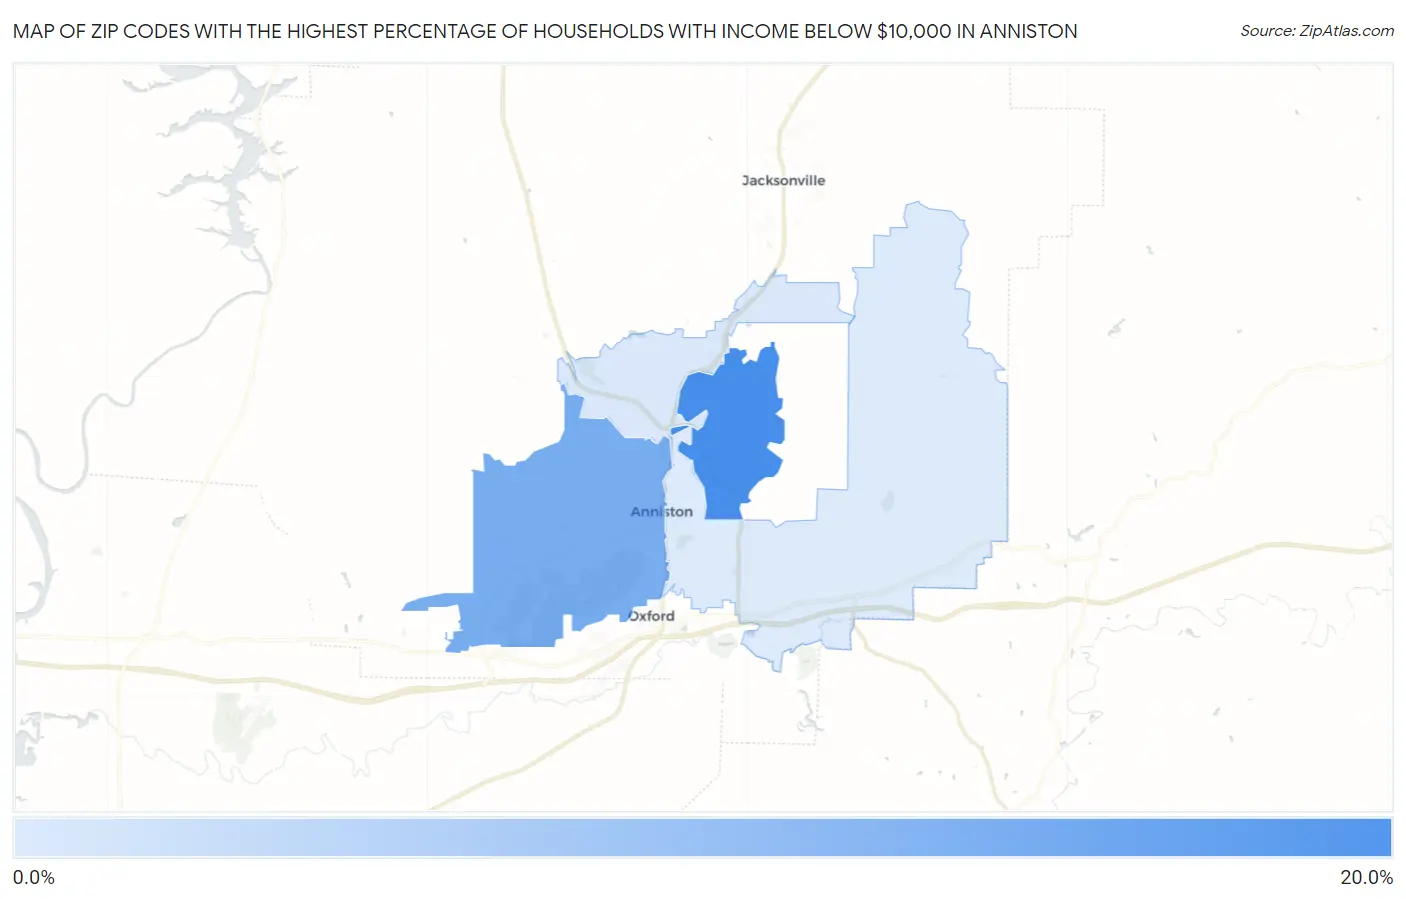
Map of Zip Codes with the Highest Percentage of Households with Income Below $10,000 in Anniston
6.0%
17.4%
Zip Codes with the Highest Percentage of Households with Income Below $10,000 in Anniston, AL
| Zip Code | Households with Income < $10k | vs State | vs National | |
| 1. | 36205 | 17.4% | 6.5%(+10.9)#34 | 4.9%(+12.5)#1,102 |
| 2. | 36201 | 13.6% | 6.5%(+7.10)#62 | 4.9%(+8.70)#1,877 |
| 3. | 36206 | 6.1% | 6.5%(-0.400)#286 | 4.9%(+1.20)#8,816 |
| 4. | 36207 | 6.0% | 6.5%(-0.500)#292 | 4.9%(+1.10)#9,018 |
1
Common Questions
What are the Top 3 Zip Codes with the Highest Percentage of Households with Income Below $10,000 in Anniston, AL?
Top 3 Zip Codes with the Highest Percentage of Households with Income Below $10,000 in Anniston, AL are:
What zip code has the Highest Percentage of Households with Income Below $10,000 in Anniston, AL?
36205 has the Highest Percentage of Households with Income Below $10,000 in Anniston, AL with 17.4%.
What is the Percentage of Households with Income Below $10,000 in Anniston, AL?
Percentage of Households with Income Below $10,000 in Anniston is 12.1%.
What is the Percentage of Households with Income Below $10,000 in Alabama?
Percentage of Households with Income Below $10,000 in Alabama is 6.5%.
What is the Percentage of Households with Income Below $10,000 in the United States?
Percentage of Households with Income Below $10,000 in the United States is 4.9%.