Zip Codes with the Highest Percentage of Population with a Degree in Communications in Birmingham, AL
RELATED REPORTS & OPTIONS
Communications
Birmingham
Compare Zip Codes
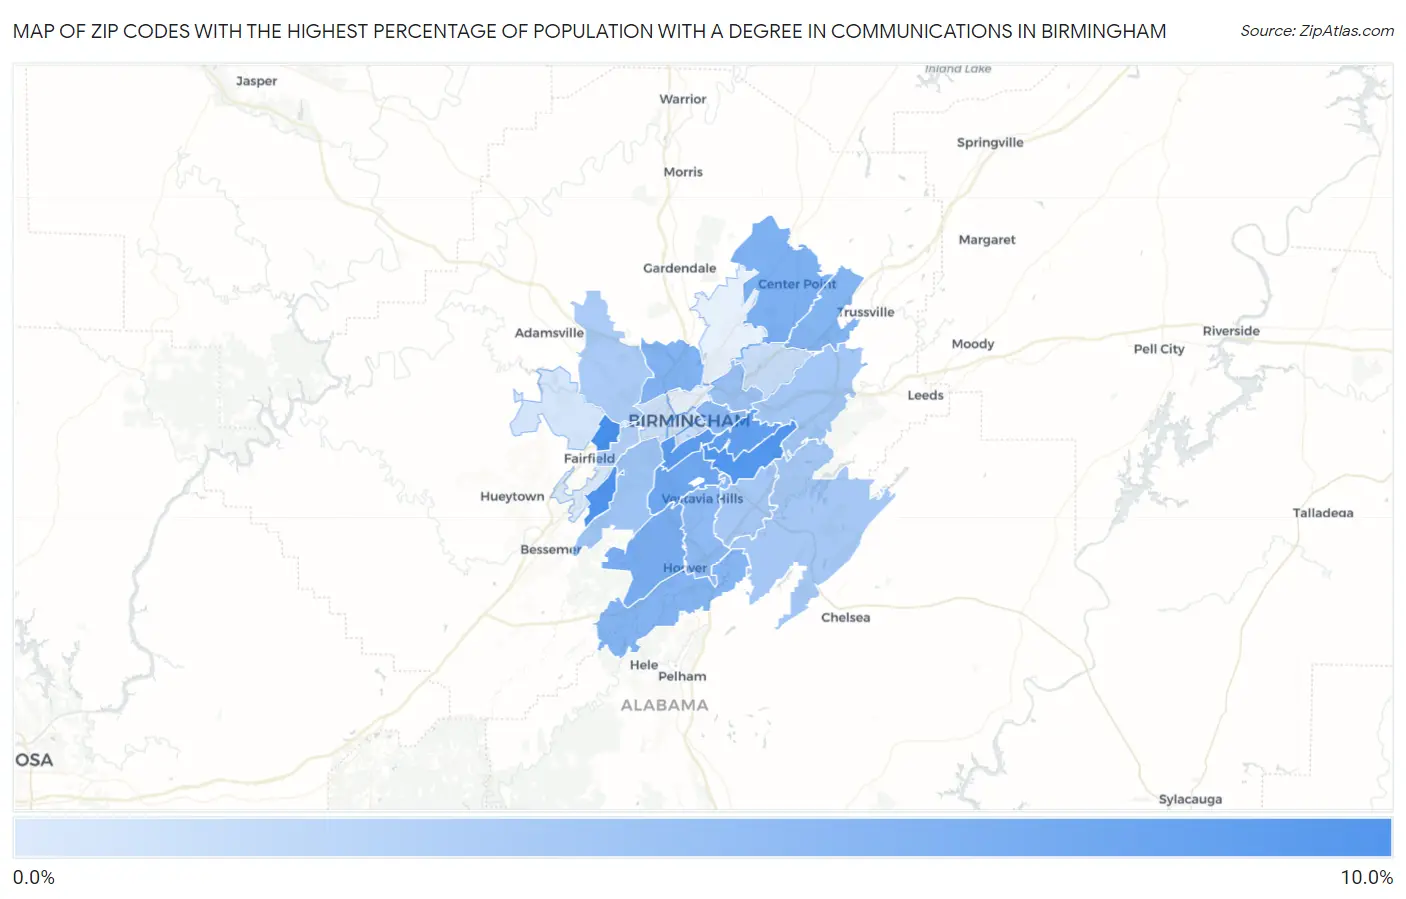
Map of Zip Codes with the Highest Percentage of Population with a Degree in Communications in Birmingham
0.38%
8.7%
Zip Codes with the Highest Percentage of Population with a Degree in Communications in Birmingham, AL
| Zip Code | % Graduates | vs State | vs National | |
| 1. | 35218 | 8.7% | 3.2%(+5.48)#18 | 4.1%(+4.52)#1,571 |
| 2. | 35221 | 8.1% | 3.2%(+4.97)#22 | 4.1%(+4.01)#1,798 |
| 3. | 35223 | 8.0% | 3.2%(+4.88)#24 | 4.1%(+3.91)#1,852 |
| 4. | 35205 | 7.4% | 3.2%(+4.25)#27 | 4.1%(+3.29)#2,250 |
| 5. | 35213 | 7.0% | 3.2%(+3.86)#32 | 4.1%(+2.89)#2,584 |
| 6. | 35209 | 6.4% | 3.2%(+3.20)#33 | 4.1%(+2.23)#3,288 |
| 7. | 35226 | 5.7% | 3.2%(+2.55)#48 | 4.1%(+1.59)#4,214 |
| 8. | 35215 | 5.7% | 3.2%(+2.53)#50 | 4.1%(+1.57)#4,267 |
| 9. | 35207 | 5.4% | 3.2%(+2.22)#58 | 4.1%(+1.26)#4,857 |
| 10. | 35235 | 5.2% | 3.2%(+2.06)#66 | 4.1%(+1.10)#5,167 |
| 11. | 35244 | 5.2% | 3.2%(+2.00)#69 | 4.1%(+1.03)#5,315 |
| 12. | 35222 | 4.8% | 3.2%(+1.64)#78 | 4.1%(+0.681)#6,143 |
| 13. | 35216 | 4.6% | 3.2%(+1.43)#86 | 4.1%(+0.470)#6,672 |
| 14. | 35212 | 4.0% | 3.2%(+0.805)#109 | 4.1%(-0.157)#8,650 |
| 15. | 35211 | 3.7% | 3.2%(+0.577)#120 | 4.1%(-0.386)#9,462 |
| 16. | 35210 | 3.5% | 3.2%(+0.345)#129 | 4.1%(-0.618)#10,263 |
| 17. | 35243 | 3.3% | 3.2%(+0.153)#142 | 4.1%(-0.809)#10,967 |
| 18. | 35242 | 3.3% | 3.2%(+0.129)#144 | 4.1%(-0.834)#11,058 |
| 19. | 35214 | 3.1% | 3.2%(-0.036)#159 | 4.1%(-0.999)#11,694 |
| 20. | 35208 | 2.6% | 3.2%(-0.539)#191 | 4.1%(-1.50)#13,656 |
| 21. | 35233 | 1.5% | 3.2%(-1.64)#257 | 4.1%(-2.60)#17,412 |
| 22. | 35206 | 1.5% | 3.2%(-1.67)#261 | 4.1%(-2.64)#17,512 |
| 23. | 35204 | 1.2% | 3.2%(-1.93)#285 | 4.1%(-2.89)#18,272 |
| 24. | 35203 | 1.2% | 3.2%(-1.94)#286 | 4.1%(-2.90)#18,284 |
| 25. | 35224 | 0.86% | 3.2%(-2.31)#314 | 4.1%(-3.28)#19,355 |
| 26. | 35228 | 0.38% | 3.2%(-2.79)#344 | 4.1%(-3.75)#20,315 |
1
Common Questions
What are the Top 10 Zip Codes with the Highest Percentage of Population with a Degree in Communications in Birmingham, AL?
Top 10 Zip Codes with the Highest Percentage of Population with a Degree in Communications in Birmingham, AL are:
What zip code has the Highest Percentage of Population with a Degree in Communications in Birmingham, AL?
35218 has the Highest Percentage of Population with a Degree in Communications in Birmingham, AL with 8.7%.
What is the Percentage of Population with a Degree in Communications in Birmingham, AL?
Percentage of Population with a Degree in Communications in Birmingham is 4.7%.
What is the Percentage of Population with a Degree in Communications in Alabama?
Percentage of Population with a Degree in Communications in Alabama is 3.2%.
What is the Percentage of Population with a Degree in Communications in the United States?
Percentage of Population with a Degree in Communications in the United States is 4.1%.