Zip Codes with the Highest Percentage of Population Employed in Architecture & Engineering in Birmingham, AL
RELATED REPORTS & OPTIONS
Architecture & Engineering
Birmingham
Compare Zip Codes
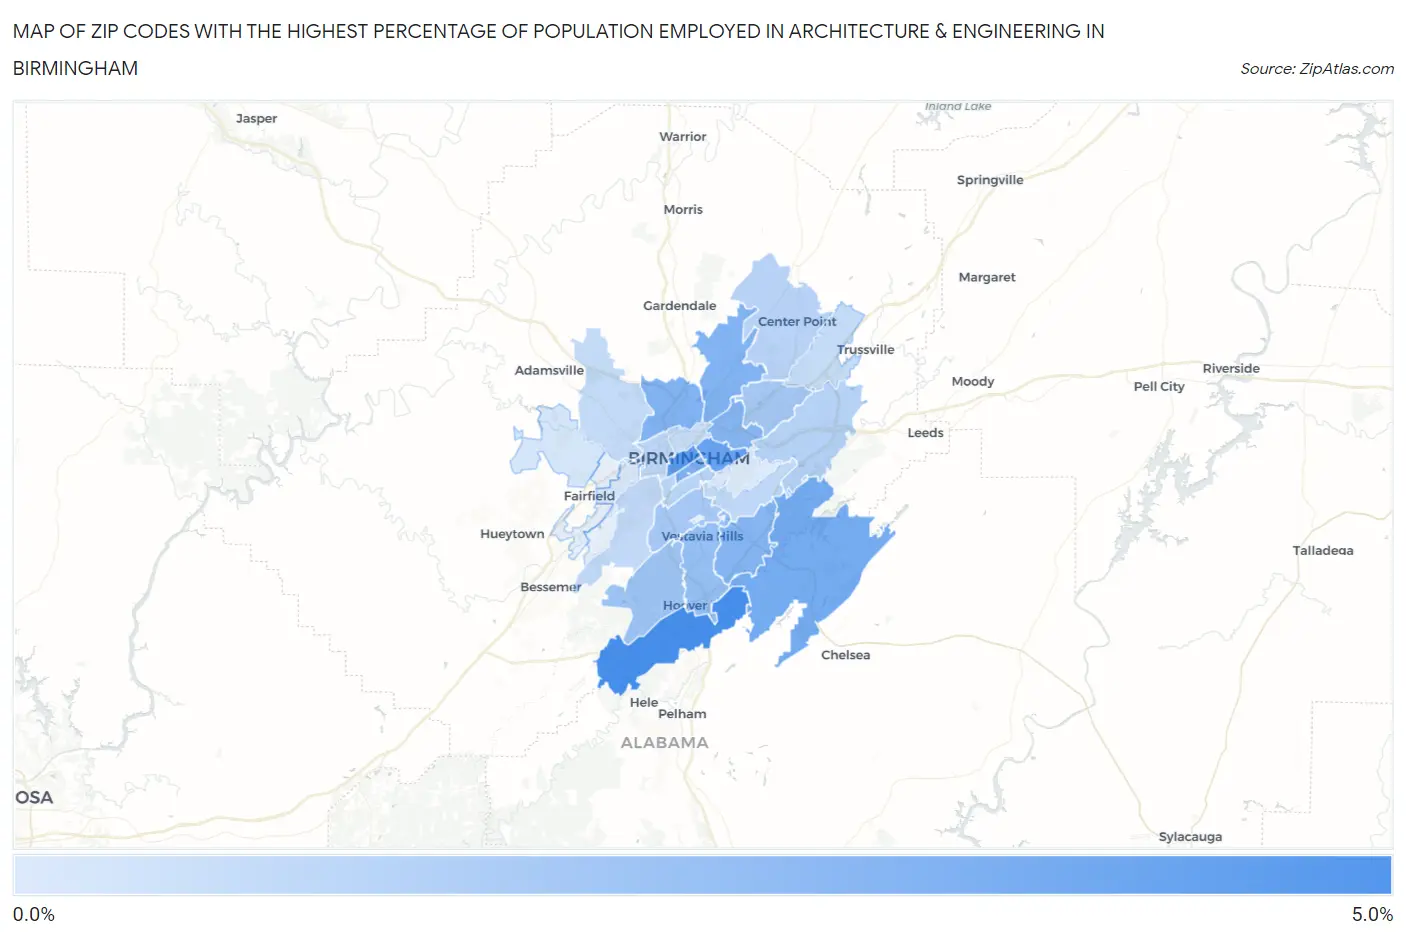
Map of Zip Codes with the Highest Percentage of Population Employed in Architecture & Engineering in Birmingham
0.17%
4.8%
Zip Codes with the Highest Percentage of Population Employed in Architecture & Engineering in Birmingham, AL
| Zip Code | % Employed | vs State | vs National | |
| 1. | 35244 | 4.8% | 2.4%(+2.44)#53 | 2.1%(+2.70)#1,785 |
| 2. | 35203 | 4.2% | 2.4%(+1.83)#66 | 2.1%(+2.09)#2,450 |
| 3. | 35222 | 3.8% | 2.4%(+1.43)#76 | 2.1%(+1.69)#3,019 |
| 4. | 35242 | 3.4% | 2.4%(+0.944)#90 | 2.1%(+1.20)#4,070 |
| 5. | 35233 | 3.1% | 2.4%(+0.735)#99 | 2.1%(+0.993)#4,621 |
| 6. | 35217 | 3.0% | 2.4%(+0.636)#107 | 2.1%(+0.893)#4,918 |
| 7. | 35207 | 3.0% | 2.4%(+0.579)#113 | 2.1%(+0.837)#5,101 |
| 8. | 35243 | 2.8% | 2.4%(+0.437)#120 | 2.1%(+0.695)#5,606 |
| 9. | 35212 | 2.8% | 2.4%(+0.395)#127 | 2.1%(+0.653)#5,786 |
| 10. | 35216 | 2.4% | 2.4%(-0.044)#156 | 2.1%(+0.214)#7,656 |
| 11. | 35226 | 2.1% | 2.4%(-0.318)#184 | 2.1%(-0.060)#9,115 |
| 12. | 35209 | 1.9% | 2.4%(-0.516)#199 | 2.1%(-0.258)#10,301 |
| 13. | 35206 | 1.9% | 2.4%(-0.546)#203 | 2.1%(-0.288)#10,473 |
| 14. | 35210 | 1.4% | 2.4%(-1.05)#263 | 2.1%(-0.797)#13,935 |
| 15. | 35215 | 1.3% | 2.4%(-1.08)#270 | 2.1%(-0.824)#14,141 |
| 16. | 35205 | 1.3% | 2.4%(-1.15)#286 | 2.1%(-0.895)#14,650 |
| 17. | 35204 | 1.1% | 2.4%(-1.33)#310 | 2.1%(-1.07)#16,014 |
| 18. | 35223 | 1.1% | 2.4%(-1.33)#311 | 2.1%(-1.07)#16,040 |
| 19. | 35211 | 1.0% | 2.4%(-1.37)#318 | 2.1%(-1.11)#16,325 |
| 20. | 35214 | 0.92% | 2.4%(-1.49)#338 | 2.1%(-1.23)#17,199 |
| 21. | 35235 | 0.84% | 2.4%(-1.56)#354 | 2.1%(-1.30)#17,801 |
| 22. | 35234 | 0.81% | 2.4%(-1.60)#359 | 2.1%(-1.34)#18,057 |
| 23. | 35224 | 0.41% | 2.4%(-2.00)#419 | 2.1%(-1.74)#20,880 |
| 24. | 35208 | 0.27% | 2.4%(-2.14)#447 | 2.1%(-1.88)#21,720 |
| 25. | 35213 | 0.17% | 2.4%(-2.24)#459 | 2.1%(-1.98)#22,189 |
1
Common Questions
What are the Top 10 Zip Codes with the Highest Percentage of Population Employed in Architecture & Engineering in Birmingham, AL?
Top 10 Zip Codes with the Highest Percentage of Population Employed in Architecture & Engineering in Birmingham, AL are:
What zip code has the Highest Percentage of Population Employed in Architecture & Engineering in Birmingham, AL?
35244 has the Highest Percentage of Population Employed in Architecture & Engineering in Birmingham, AL with 4.8%.
What is the Percentage of Population Employed in Architecture & Engineering in Birmingham, AL?
Percentage of Population Employed in Architecture & Engineering in Birmingham is 1.3%.
What is the Percentage of Population Employed in Architecture & Engineering in Alabama?
Percentage of Population Employed in Architecture & Engineering in Alabama is 2.4%.
What is the Percentage of Population Employed in Architecture & Engineering in the United States?
Percentage of Population Employed in Architecture & Engineering in the United States is 2.1%.