Zip Codes with the Highest Percentage of Households with Income Below $10,000 in Mobile, AL
RELATED REPORTS & OPTIONS
Household Income | $0-10k
Mobile
Compare Zip Codes
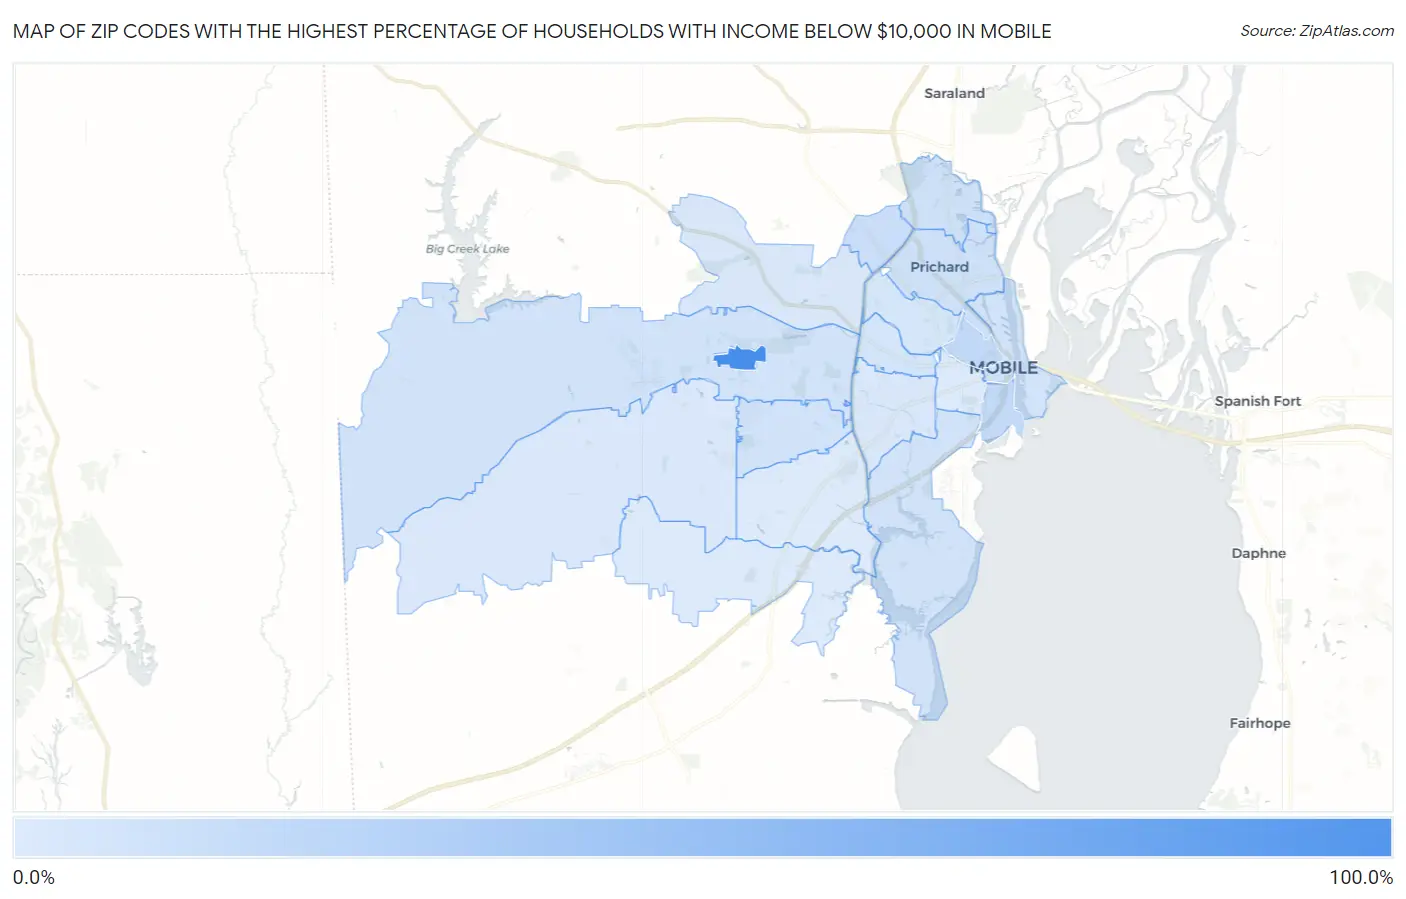
Map of Zip Codes with the Highest Percentage of Households with Income Below $10,000 in Mobile
4.5%
89.3%
Zip Codes with the Highest Percentage of Households with Income Below $10,000 in Mobile, AL
| Zip Code | Households with Income < $10k | vs State | vs National | |
| 1. | 36688 | 89.3% | 6.5%(+82.8)#2 | 4.9%(+84.4)#38 |
| 2. | 36603 | 16.5% | 6.5%(+10.00)#40 | 4.9%(+11.6)#1,247 |
| 3. | 36612 | 12.0% | 6.5%(+5.50)#89 | 4.9%(+7.10)#2,466 |
| 4. | 36610 | 10.9% | 6.5%(+4.40)#108 | 4.9%(+6.00)#3,014 |
| 5. | 36611 | 10.8% | 6.5%(+4.30)#109 | 4.9%(+5.90)#3,077 |
| 6. | 36609 | 9.8% | 6.5%(+3.30)#136 | 4.9%(+4.90)#3,714 |
| 7. | 36602 | 9.3% | 6.5%(+2.80)#152 | 4.9%(+4.40)#4,169 |
| 8. | 36605 | 9.2% | 6.5%(+2.70)#154 | 4.9%(+4.30)#4,207 |
| 9. | 36608 | 9.0% | 6.5%(+2.50)#161 | 4.9%(+4.10)#4,398 |
| 10. | 36607 | 8.6% | 6.5%(+2.10)#180 | 4.9%(+3.70)#4,857 |
| 11. | 36617 | 7.4% | 6.5%(+0.900)#226 | 4.9%(+2.50)#6,379 |
| 12. | 36606 | 6.0% | 6.5%(-0.500)#293 | 4.9%(+1.10)#9,019 |
| 13. | 36618 | 6.0% | 6.5%(-0.500)#294 | 4.9%(+1.10)#9,025 |
| 14. | 36695 | 5.5% | 6.5%(-1.00)#321 | 4.9%(+0.600)#10,192 |
| 15. | 36604 | 4.8% | 6.5%(-1.70)#369 | 4.9%(-0.100)#12,403 |
| 16. | 36619 | 4.7% | 6.5%(-1.80)#376 | 4.9%(-0.200)#12,726 |
| 17. | 36693 | 4.5% | 6.5%(-2.00)#390 | 4.9%(-0.400)#13,402 |
1
Common Questions
What are the Top 10 Zip Codes with the Highest Percentage of Households with Income Below $10,000 in Mobile, AL?
Top 10 Zip Codes with the Highest Percentage of Households with Income Below $10,000 in Mobile, AL are:
What zip code has the Highest Percentage of Households with Income Below $10,000 in Mobile, AL?
36688 has the Highest Percentage of Households with Income Below $10,000 in Mobile, AL with 89.3%.
What is the Percentage of Households with Income Below $10,000 in Mobile, AL?
Percentage of Households with Income Below $10,000 in Mobile is 8.1%.
What is the Percentage of Households with Income Below $10,000 in Alabama?
Percentage of Households with Income Below $10,000 in Alabama is 6.5%.
What is the Percentage of Households with Income Below $10,000 in the United States?
Percentage of Households with Income Below $10,000 in the United States is 4.9%.