Vietnamese vs German Russian No Vehicles in Household
COMPARE
Vietnamese
German Russian
No Vehicles in Household
No Vehicles in Household Comparison
Vietnamese
German Russians
26.2%
NO VEHICLES IN HOUSEHOLD
0.0/ 100
METRIC RATING
336th/ 347
METRIC RANK
10.5%
NO VEHICLES IN HOUSEHOLD
40.6/ 100
METRIC RATING
186th/ 347
METRIC RANK
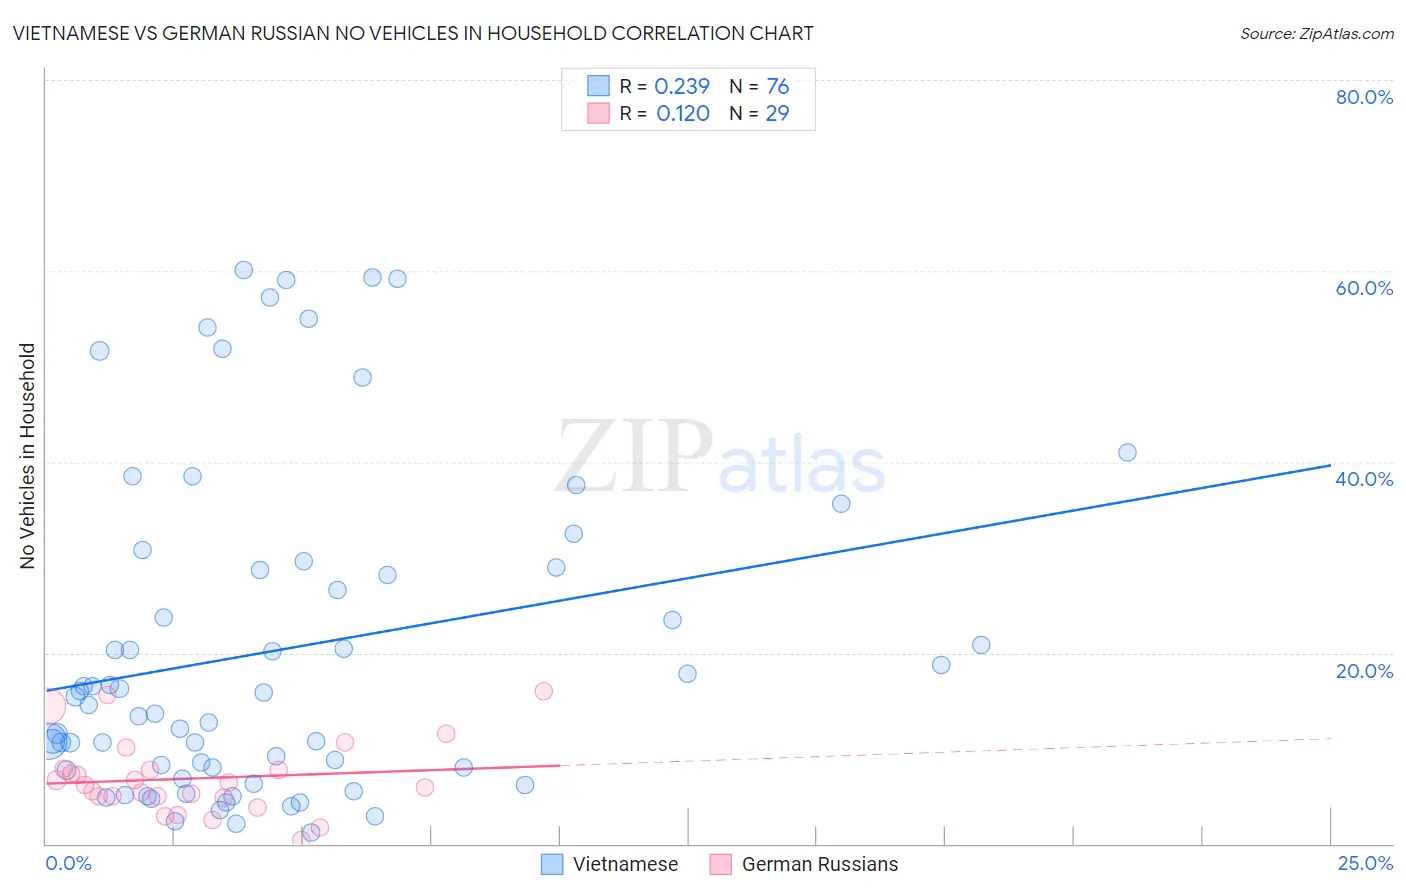
Vietnamese vs German Russian No Vehicles in Household Correlation Chart
The statistical analysis conducted on geographies consisting of 170,596,968 people shows a weak positive correlation between the proportion of Vietnamese and percentage of households with no vehicle available in the United States with a correlation coefficient (R) of 0.239 and weighted average of 26.2%. Similarly, the statistical analysis conducted on geographies consisting of 96,374,316 people shows a poor positive correlation between the proportion of German Russians and percentage of households with no vehicle available in the United States with a correlation coefficient (R) of 0.120 and weighted average of 10.5%, a difference of 148.9%.
No Vehicles in Household Correlation Summary
| Measurement | Vietnamese | German Russian |
| Minimum | 1.2% | 0.38% |
| Maximum | 60.1% | 16.0% |
| Range | 58.8% | 15.6% |
| Mean | 20.3% | 6.8% |
| Median | 15.0% | 6.2% |
| Interquartile 25% (IQ1) | 7.8% | 4.9% |
| Interquartile 75% (IQ3) | 28.8% | 7.8% |
| Interquartile Range (IQR) | 21.0% | 2.9% |
| Standard Deviation (Sample) | 16.9% | 3.9% |
| Standard Deviation (Population) | 16.8% | 3.8% |
Similar Demographics by No Vehicles in Household
Demographics Similar to Vietnamese by No Vehicles in Household
In terms of no vehicles in household, the demographic groups most similar to Vietnamese are Barbadian (26.1%, a difference of 0.56%), Immigrants from Uzbekistan (26.7%, a difference of 1.7%), Immigrants from Bangladesh (25.8%, a difference of 1.9%), Immigrants from Trinidad and Tobago (24.6%, a difference of 6.5%), and Immigrants from Ecuador (23.8%, a difference of 10.1%).
| Demographics | Rating | Rank | No Vehicles in Household |
| Ecuadorians | 0.0 /100 | #329 | Tragic 22.8% |
| West Indians | 0.0 /100 | #330 | Tragic 23.7% |
| Trinidadians and Tobagonians | 0.0 /100 | #331 | Tragic 23.7% |
| Immigrants | Ecuador | 0.0 /100 | #332 | Tragic 23.8% |
| Immigrants | Trinidad and Tobago | 0.0 /100 | #333 | Tragic 24.6% |
| Immigrants | Bangladesh | 0.0 /100 | #334 | Tragic 25.8% |
| Barbadians | 0.0 /100 | #335 | Tragic 26.1% |
| Vietnamese | 0.0 /100 | #336 | Tragic 26.2% |
| Immigrants | Uzbekistan | 0.0 /100 | #337 | Tragic 26.7% |
| Guyanese | 0.0 /100 | #338 | Tragic 29.3% |
| Dominicans | 0.0 /100 | #339 | Tragic 29.4% |
| Immigrants | Barbados | 0.0 /100 | #340 | Tragic 29.5% |
| Immigrants | Guyana | 0.0 /100 | #341 | Tragic 29.5% |
| British West Indians | 0.0 /100 | #342 | Tragic 29.7% |
| Inupiat | 0.0 /100 | #343 | Tragic 29.9% |
Demographics Similar to German Russians by No Vehicles in Household
In terms of no vehicles in household, the demographic groups most similar to German Russians are South American (10.5%, a difference of 0.18%), Immigrants from Nepal (10.5%, a difference of 0.25%), Immigrants from Poland (10.6%, a difference of 0.31%), Native/Alaskan (10.5%, a difference of 0.42%), and Immigrants from Armenia (10.6%, a difference of 0.43%).
| Demographics | Rating | Rank | No Vehicles in Household |
| Ethiopians | 45.8 /100 | #179 | Average 10.5% |
| Arabs | 45.3 /100 | #180 | Average 10.5% |
| Immigrants | Colombia | 44.1 /100 | #181 | Average 10.5% |
| Immigrants | Bulgaria | 43.8 /100 | #182 | Average 10.5% |
| Natives/Alaskans | 43.7 /100 | #183 | Average 10.5% |
| Immigrants | Nepal | 42.4 /100 | #184 | Average 10.5% |
| South Americans | 41.9 /100 | #185 | Average 10.5% |
| German Russians | 40.6 /100 | #186 | Average 10.5% |
| Immigrants | Poland | 38.4 /100 | #187 | Fair 10.6% |
| Immigrants | Armenia | 37.5 /100 | #188 | Fair 10.6% |
| Immigrants | Eritrea | 36.3 /100 | #189 | Fair 10.6% |
| Immigrants | North Macedonia | 34.6 /100 | #190 | Fair 10.6% |
| Immigrants | Northern Europe | 33.1 /100 | #191 | Fair 10.7% |
| Carpatho Rusyns | 32.1 /100 | #192 | Fair 10.7% |
| Ukrainians | 28.0 /100 | #193 | Fair 10.7% |