Thai vs Fijian No Vehicles in Household
COMPARE
Thai
Fijian
No Vehicles in Household
No Vehicles in Household Comparison
Thais
Fijians
8.2%
NO VEHICLES IN HOUSEHOLD
99.8/ 100
METRIC RATING
61st/ 347
METRIC RANK
9.5%
NO VEHICLES IN HOUSEHOLD
92.7/ 100
METRIC RATING
119th/ 347
METRIC RANK
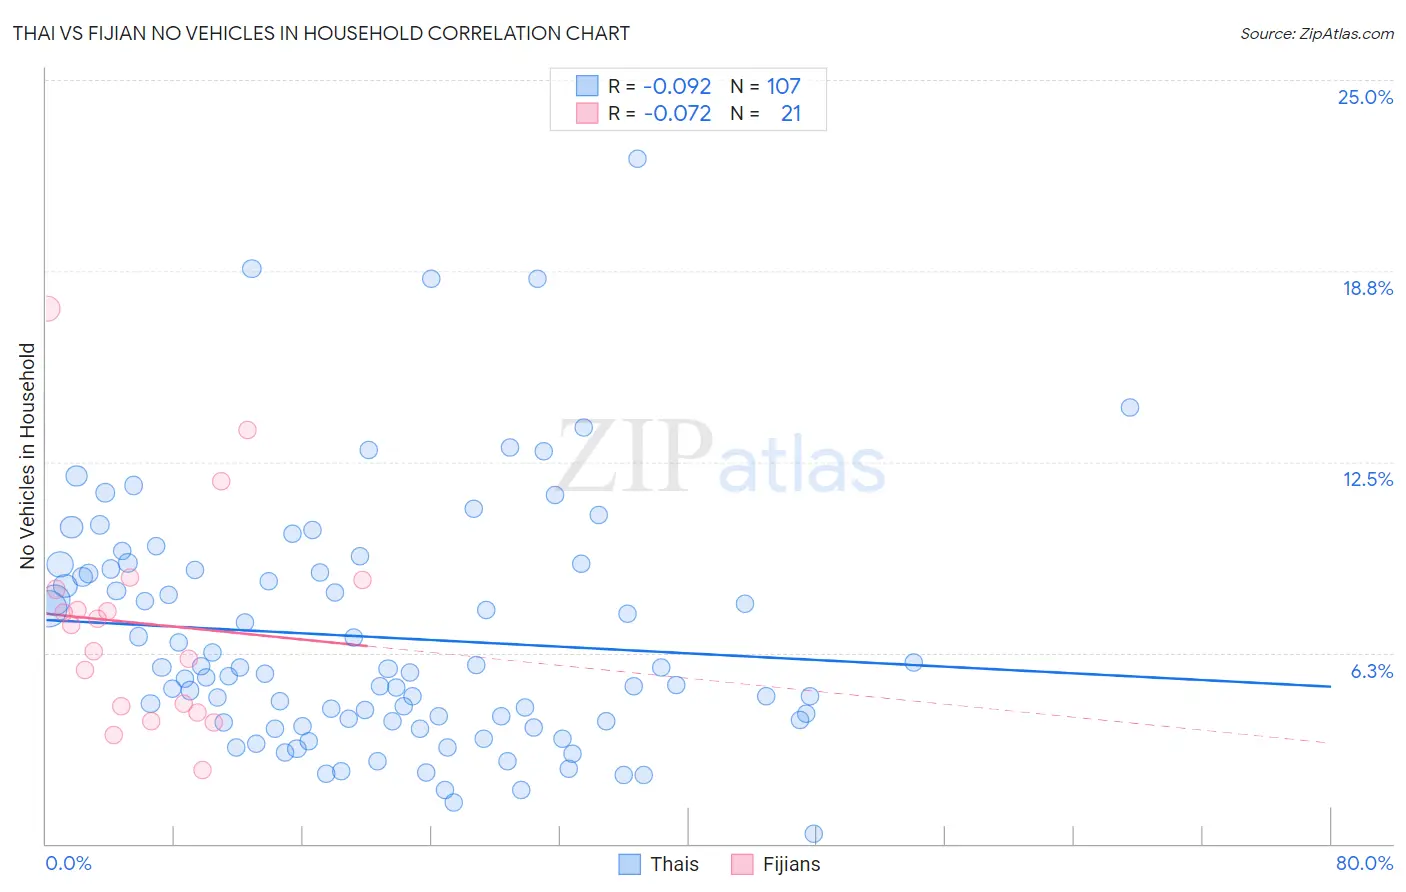
Thai vs Fijian No Vehicles in Household Correlation Chart
The statistical analysis conducted on geographies consisting of 455,165,569 people shows a slight negative correlation between the proportion of Thais and percentage of households with no vehicle available in the United States with a correlation coefficient (R) of -0.092 and weighted average of 8.2%. Similarly, the statistical analysis conducted on geographies consisting of 55,930,698 people shows a slight negative correlation between the proportion of Fijians and percentage of households with no vehicle available in the United States with a correlation coefficient (R) of -0.072 and weighted average of 9.5%, a difference of 16.2%.
No Vehicles in Household Correlation Summary
| Measurement | Thai | Fijian |
| Minimum | 0.34% | 2.4% |
| Maximum | 22.4% | 17.5% |
| Range | 22.1% | 15.1% |
| Mean | 6.8% | 7.2% |
| Median | 5.6% | 7.2% |
| Interquartile 25% (IQ1) | 4.0% | 4.4% |
| Interquartile 75% (IQ3) | 9.0% | 8.5% |
| Interquartile Range (IQR) | 5.0% | 4.1% |
| Standard Deviation (Sample) | 4.0% | 3.6% |
| Standard Deviation (Population) | 4.0% | 3.5% |
Similar Demographics by No Vehicles in Household
Demographics Similar to Thais by No Vehicles in Household
In terms of no vehicles in household, the demographic groups most similar to Thais are Immigrants from Laos (8.2%, a difference of 0.17%), Immigrants from India (8.2%, a difference of 0.24%), Chinese (8.2%, a difference of 0.46%), Immigrants from Mexico (8.1%, a difference of 0.59%), and Venezuelan (8.1%, a difference of 0.69%).
| Demographics | Rating | Rank | No Vehicles in Household |
| Immigrants | Venezuela | 99.9 /100 | #54 | Exceptional 8.1% |
| Celtics | 99.9 /100 | #55 | Exceptional 8.1% |
| Immigrants | Afghanistan | 99.9 /100 | #56 | Exceptional 8.1% |
| Venezuelans | 99.8 /100 | #57 | Exceptional 8.1% |
| Immigrants | Mexico | 99.8 /100 | #58 | Exceptional 8.1% |
| Immigrants | India | 99.8 /100 | #59 | Exceptional 8.2% |
| Immigrants | Laos | 99.8 /100 | #60 | Exceptional 8.2% |
| Thais | 99.8 /100 | #61 | Exceptional 8.2% |
| Chinese | 99.8 /100 | #62 | Exceptional 8.2% |
| Slovaks | 99.8 /100 | #63 | Exceptional 8.3% |
| Croatians | 99.8 /100 | #64 | Exceptional 8.3% |
| Canadians | 99.7 /100 | #65 | Exceptional 8.3% |
| Palestinians | 99.7 /100 | #66 | Exceptional 8.3% |
| Immigrants | Scotland | 99.7 /100 | #67 | Exceptional 8.3% |
| Immigrants | Iran | 99.7 /100 | #68 | Exceptional 8.4% |
Demographics Similar to Fijians by No Vehicles in Household
In terms of no vehicles in household, the demographic groups most similar to Fijians are Immigrants from Thailand (9.5%, a difference of 0.060%), Greek (9.5%, a difference of 0.11%), Puget Sound Salish (9.5%, a difference of 0.16%), Costa Rican (9.5%, a difference of 0.21%), and Chippewa (9.4%, a difference of 0.66%).
| Demographics | Rating | Rank | No Vehicles in Household |
| Armenians | 95.0 /100 | #112 | Exceptional 9.4% |
| Immigrants | Netherlands | 94.8 /100 | #113 | Exceptional 9.4% |
| Serbians | 94.3 /100 | #114 | Exceptional 9.4% |
| Navajo | 94.2 /100 | #115 | Exceptional 9.4% |
| Japanese | 94.1 /100 | #116 | Exceptional 9.4% |
| Chippewa | 93.8 /100 | #117 | Exceptional 9.4% |
| Greeks | 92.9 /100 | #118 | Exceptional 9.5% |
| Fijians | 92.7 /100 | #119 | Exceptional 9.5% |
| Immigrants | Thailand | 92.6 /100 | #120 | Exceptional 9.5% |
| Puget Sound Salish | 92.4 /100 | #121 | Exceptional 9.5% |
| Costa Ricans | 92.3 /100 | #122 | Exceptional 9.5% |
| Blackfeet | 91.4 /100 | #123 | Exceptional 9.6% |
| Immigrants | Korea | 90.9 /100 | #124 | Exceptional 9.6% |
| Immigrants | Cameroon | 90.6 /100 | #125 | Exceptional 9.6% |
| Icelanders | 90.2 /100 | #126 | Exceptional 9.6% |