Thai vs Immigrants from Hungary No Vehicles in Household
COMPARE
Thai
Immigrants from Hungary
No Vehicles in Household
No Vehicles in Household Comparison
Thais
Immigrants from Hungary
8.2%
NO VEHICLES IN HOUSEHOLD
99.8/ 100
METRIC RATING
61st/ 347
METRIC RANK
11.1%
NO VEHICLES IN HOUSEHOLD
12.3/ 100
METRIC RATING
213th/ 347
METRIC RANK
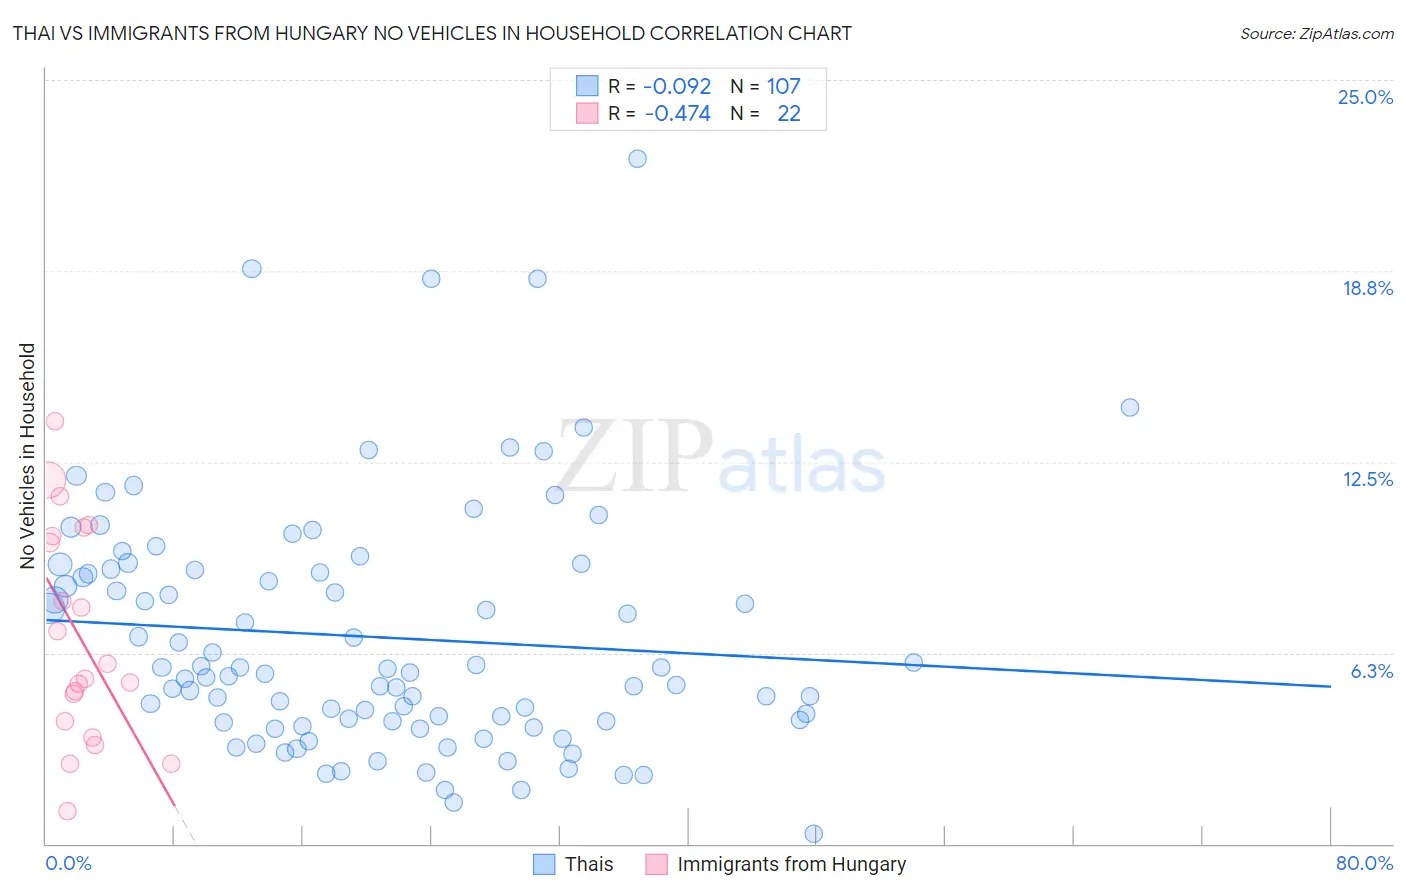
Thai vs Immigrants from Hungary No Vehicles in Household Correlation Chart
The statistical analysis conducted on geographies consisting of 455,165,569 people shows a slight negative correlation between the proportion of Thais and percentage of households with no vehicle available in the United States with a correlation coefficient (R) of -0.092 and weighted average of 8.2%. Similarly, the statistical analysis conducted on geographies consisting of 195,539,885 people shows a moderate negative correlation between the proportion of Immigrants from Hungary and percentage of households with no vehicle available in the United States with a correlation coefficient (R) of -0.474 and weighted average of 11.1%, a difference of 35.6%.
No Vehicles in Household Correlation Summary
| Measurement | Thai | Immigrants from Hungary |
| Minimum | 0.34% | 1.1% |
| Maximum | 22.4% | 13.8% |
| Range | 22.1% | 12.7% |
| Mean | 6.8% | 6.8% |
| Median | 5.6% | 5.7% |
| Interquartile 25% (IQ1) | 4.0% | 4.0% |
| Interquartile 75% (IQ3) | 9.0% | 10.1% |
| Interquartile Range (IQR) | 5.0% | 6.1% |
| Standard Deviation (Sample) | 4.0% | 3.5% |
| Standard Deviation (Population) | 4.0% | 3.4% |
Similar Demographics by No Vehicles in Household
Demographics Similar to Thais by No Vehicles in Household
In terms of no vehicles in household, the demographic groups most similar to Thais are Immigrants from Laos (8.2%, a difference of 0.17%), Immigrants from India (8.2%, a difference of 0.24%), Chinese (8.2%, a difference of 0.46%), Immigrants from Mexico (8.1%, a difference of 0.59%), and Venezuelan (8.1%, a difference of 0.69%).
| Demographics | Rating | Rank | No Vehicles in Household |
| Immigrants | Venezuela | 99.9 /100 | #54 | Exceptional 8.1% |
| Celtics | 99.9 /100 | #55 | Exceptional 8.1% |
| Immigrants | Afghanistan | 99.9 /100 | #56 | Exceptional 8.1% |
| Venezuelans | 99.8 /100 | #57 | Exceptional 8.1% |
| Immigrants | Mexico | 99.8 /100 | #58 | Exceptional 8.1% |
| Immigrants | India | 99.8 /100 | #59 | Exceptional 8.2% |
| Immigrants | Laos | 99.8 /100 | #60 | Exceptional 8.2% |
| Thais | 99.8 /100 | #61 | Exceptional 8.2% |
| Chinese | 99.8 /100 | #62 | Exceptional 8.2% |
| Slovaks | 99.8 /100 | #63 | Exceptional 8.3% |
| Croatians | 99.8 /100 | #64 | Exceptional 8.3% |
| Canadians | 99.7 /100 | #65 | Exceptional 8.3% |
| Palestinians | 99.7 /100 | #66 | Exceptional 8.3% |
| Immigrants | Scotland | 99.7 /100 | #67 | Exceptional 8.3% |
| Immigrants | Iran | 99.7 /100 | #68 | Exceptional 8.4% |
Demographics Similar to Immigrants from Hungary by No Vehicles in Household
In terms of no vehicles in household, the demographic groups most similar to Immigrants from Hungary are Immigrants from Denmark (11.1%, a difference of 0.070%), Immigrants from Western Asia (11.0%, a difference of 0.43%), Crow (11.0%, a difference of 0.52%), Immigrants from Sri Lanka (11.2%, a difference of 0.53%), and Immigrants from Argentina (11.2%, a difference of 0.54%).
| Demographics | Rating | Rank | No Vehicles in Household |
| Somalis | 15.9 /100 | #206 | Poor 11.0% |
| Sierra Leoneans | 15.7 /100 | #207 | Poor 11.0% |
| Immigrants | Italy | 15.6 /100 | #208 | Poor 11.0% |
| Pennsylvania Germans | 15.5 /100 | #209 | Poor 11.0% |
| Apache | 14.8 /100 | #210 | Poor 11.0% |
| Crow | 14.2 /100 | #211 | Poor 11.0% |
| Immigrants | Western Asia | 13.9 /100 | #212 | Poor 11.0% |
| Immigrants | Hungary | 12.3 /100 | #213 | Poor 11.1% |
| Immigrants | Denmark | 12.1 /100 | #214 | Poor 11.1% |
| Immigrants | Sri Lanka | 10.6 /100 | #215 | Poor 11.2% |
| Immigrants | Argentina | 10.6 /100 | #216 | Poor 11.2% |
| Dutch West Indians | 10.2 /100 | #217 | Poor 11.2% |
| Immigrants | Guatemala | 10.0 /100 | #218 | Tragic 11.2% |
| Argentineans | 9.6 /100 | #219 | Tragic 11.2% |
| Immigrants | Zaire | 9.6 /100 | #220 | Tragic 11.2% |