French vs Lebanese No Vehicles in Household
COMPARE
French
Lebanese
No Vehicles in Household
No Vehicles in Household Comparison
French
Lebanese
7.4%
NO VEHICLES IN HOUSEHOLD
100.0/ 100
METRIC RATING
23rd/ 347
METRIC RANK
8.7%
NO VEHICLES IN HOUSEHOLD
99.3/ 100
METRIC RATING
85th/ 347
METRIC RANK
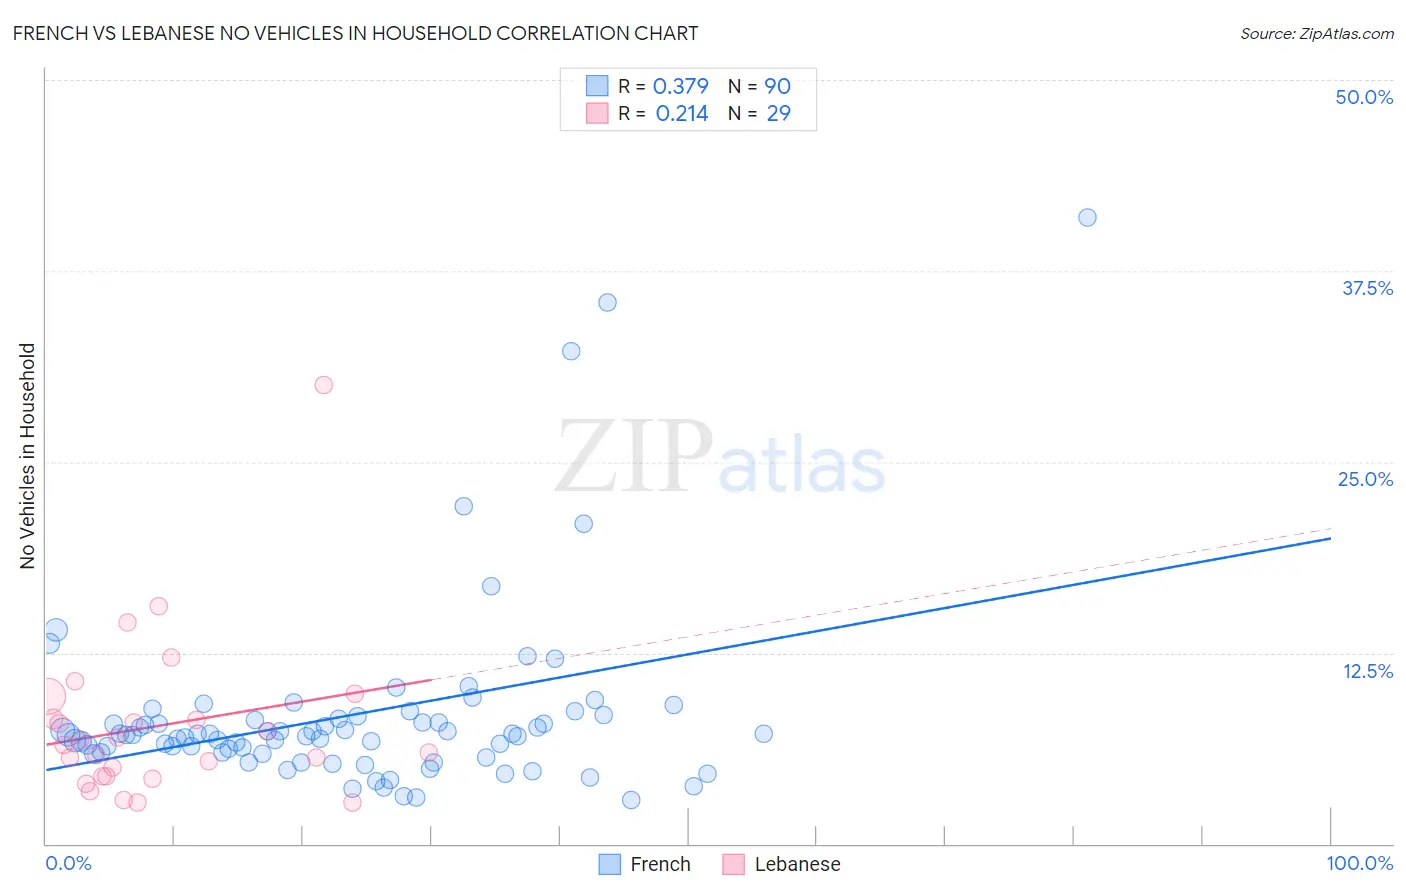
French vs Lebanese No Vehicles in Household Correlation Chart
The statistical analysis conducted on geographies consisting of 566,745,799 people shows a mild positive correlation between the proportion of French and percentage of households with no vehicle available in the United States with a correlation coefficient (R) of 0.379 and weighted average of 7.4%. Similarly, the statistical analysis conducted on geographies consisting of 400,489,839 people shows a weak positive correlation between the proportion of Lebanese and percentage of households with no vehicle available in the United States with a correlation coefficient (R) of 0.214 and weighted average of 8.7%, a difference of 16.3%.
No Vehicles in Household Correlation Summary
| Measurement | French | Lebanese |
| Minimum | 2.9% | 2.7% |
| Maximum | 41.0% | 30.0% |
| Range | 38.1% | 27.3% |
| Mean | 8.4% | 7.7% |
| Median | 7.1% | 6.5% |
| Interquartile 25% (IQ1) | 6.0% | 4.4% |
| Interquartile 75% (IQ3) | 8.2% | 8.9% |
| Interquartile Range (IQR) | 2.2% | 4.5% |
| Standard Deviation (Sample) | 6.1% | 5.4% |
| Standard Deviation (Population) | 6.1% | 5.3% |
Similar Demographics by No Vehicles in Household
Demographics Similar to French by No Vehicles in Household
In terms of no vehicles in household, the demographic groups most similar to French are Irish (7.4%, a difference of 0.050%), Immigrants from Iraq (7.5%, a difference of 0.39%), Yaqui (7.5%, a difference of 0.56%), Nepalese (7.4%, a difference of 0.65%), and Ottawa (7.4%, a difference of 0.80%).
| Demographics | Rating | Rank | No Vehicles in Household |
| Europeans | 100.0 /100 | #16 | Exceptional 7.1% |
| Welsh | 100.0 /100 | #17 | Exceptional 7.2% |
| Tongans | 100.0 /100 | #18 | Exceptional 7.2% |
| Arapaho | 100.0 /100 | #19 | Exceptional 7.4% |
| Ottawa | 100.0 /100 | #20 | Exceptional 7.4% |
| Nepalese | 100.0 /100 | #21 | Exceptional 7.4% |
| Irish | 100.0 /100 | #22 | Exceptional 7.4% |
| French | 100.0 /100 | #23 | Exceptional 7.4% |
| Immigrants | Iraq | 100.0 /100 | #24 | Exceptional 7.5% |
| Yaqui | 100.0 /100 | #25 | Exceptional 7.5% |
| Sri Lankans | 100.0 /100 | #26 | Exceptional 7.6% |
| British | 100.0 /100 | #27 | Exceptional 7.6% |
| Samoans | 100.0 /100 | #28 | Exceptional 7.6% |
| Americans | 100.0 /100 | #29 | Exceptional 7.7% |
| Finns | 100.0 /100 | #30 | Exceptional 7.7% |
Demographics Similar to Lebanese by No Vehicles in Household
In terms of no vehicles in household, the demographic groups most similar to Lebanese are Immigrants from Jordan (8.7%, a difference of 0.060%), Bangladeshi (8.7%, a difference of 0.11%), Italian (8.6%, a difference of 0.31%), Immigrants from England (8.7%, a difference of 0.33%), and Osage (8.7%, a difference of 0.45%).
| Demographics | Rating | Rank | No Vehicles in Household |
| Immigrants | South Central Asia | 99.5 /100 | #78 | Exceptional 8.6% |
| Portuguese | 99.5 /100 | #79 | Exceptional 8.6% |
| Bolivians | 99.4 /100 | #80 | Exceptional 8.6% |
| Tsimshian | 99.4 /100 | #81 | Exceptional 8.6% |
| Immigrants | South Eastern Asia | 99.4 /100 | #82 | Exceptional 8.6% |
| Italians | 99.4 /100 | #83 | Exceptional 8.6% |
| Immigrants | Jordan | 99.3 /100 | #84 | Exceptional 8.7% |
| Lebanese | 99.3 /100 | #85 | Exceptional 8.7% |
| Bangladeshis | 99.3 /100 | #86 | Exceptional 8.7% |
| Immigrants | England | 99.2 /100 | #87 | Exceptional 8.7% |
| Osage | 99.2 /100 | #88 | Exceptional 8.7% |
| Immigrants | Cuba | 99.2 /100 | #89 | Exceptional 8.7% |
| Bhutanese | 99.2 /100 | #90 | Exceptional 8.7% |
| Immigrants | Germany | 99.1 /100 | #91 | Exceptional 8.7% |
| Immigrants | Canada | 99.1 /100 | #92 | Exceptional 8.7% |