Serbian vs Immigrants from Portugal No Vehicles in Household
COMPARE
Serbian
Immigrants from Portugal
No Vehicles in Household
No Vehicles in Household Comparison
Serbians
Immigrants from Portugal
9.4%
NO VEHICLES IN HOUSEHOLD
94.3/ 100
METRIC RATING
114th/ 347
METRIC RANK
11.7%
NO VEHICLES IN HOUSEHOLD
2.2/ 100
METRIC RATING
244th/ 347
METRIC RANK
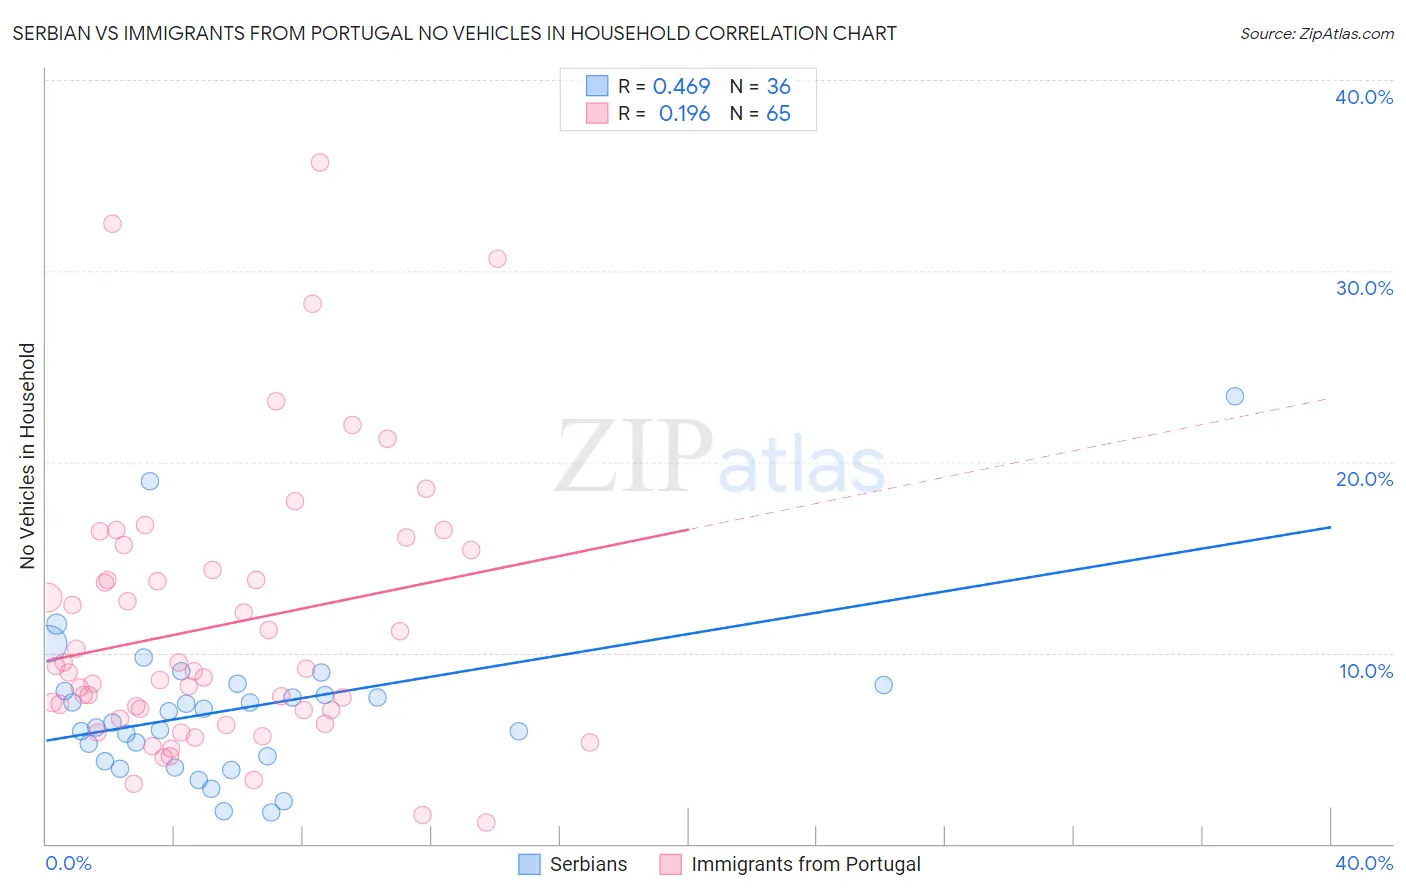
Serbian vs Immigrants from Portugal No Vehicles in Household Correlation Chart
The statistical analysis conducted on geographies consisting of 267,180,680 people shows a moderate positive correlation between the proportion of Serbians and percentage of households with no vehicle available in the United States with a correlation coefficient (R) of 0.469 and weighted average of 9.4%. Similarly, the statistical analysis conducted on geographies consisting of 174,581,030 people shows a poor positive correlation between the proportion of Immigrants from Portugal and percentage of households with no vehicle available in the United States with a correlation coefficient (R) of 0.196 and weighted average of 11.7%, a difference of 24.6%.
No Vehicles in Household Correlation Summary
| Measurement | Serbian | Immigrants from Portugal |
| Minimum | 1.6% | 1.1% |
| Maximum | 23.5% | 35.7% |
| Range | 21.9% | 34.6% |
| Mean | 7.1% | 11.4% |
| Median | 6.6% | 9.0% |
| Interquartile 25% (IQ1) | 4.5% | 6.8% |
| Interquartile 75% (IQ3) | 8.2% | 14.9% |
| Interquartile Range (IQR) | 3.7% | 8.1% |
| Standard Deviation (Sample) | 4.2% | 7.2% |
| Standard Deviation (Population) | 4.2% | 7.1% |
Similar Demographics by No Vehicles in Household
Demographics Similar to Serbians by No Vehicles in Household
In terms of no vehicles in household, the demographic groups most similar to Serbians are Navajo (9.4%, a difference of 0.070%), Japanese (9.4%, a difference of 0.13%), Chippewa (9.4%, a difference of 0.30%), Immigrants from Netherlands (9.4%, a difference of 0.43%), and Armenian (9.4%, a difference of 0.52%).
| Demographics | Rating | Rank | No Vehicles in Household |
| Hispanics or Latinos | 97.7 /100 | #107 | Exceptional 9.1% |
| Mexican American Indians | 97.6 /100 | #108 | Exceptional 9.1% |
| Maltese | 97.6 /100 | #109 | Exceptional 9.1% |
| Delaware | 97.2 /100 | #110 | Exceptional 9.2% |
| Immigrants | Kuwait | 95.1 /100 | #111 | Exceptional 9.4% |
| Armenians | 95.0 /100 | #112 | Exceptional 9.4% |
| Immigrants | Netherlands | 94.8 /100 | #113 | Exceptional 9.4% |
| Serbians | 94.3 /100 | #114 | Exceptional 9.4% |
| Navajo | 94.2 /100 | #115 | Exceptional 9.4% |
| Japanese | 94.1 /100 | #116 | Exceptional 9.4% |
| Chippewa | 93.8 /100 | #117 | Exceptional 9.4% |
| Greeks | 92.9 /100 | #118 | Exceptional 9.5% |
| Fijians | 92.7 /100 | #119 | Exceptional 9.5% |
| Immigrants | Thailand | 92.6 /100 | #120 | Exceptional 9.5% |
| Puget Sound Salish | 92.4 /100 | #121 | Exceptional 9.5% |
Demographics Similar to Immigrants from Portugal by No Vehicles in Household
In terms of no vehicles in household, the demographic groups most similar to Immigrants from Portugal are Cheyenne (11.7%, a difference of 0.18%), Immigrants from Honduras (11.8%, a difference of 0.19%), Menominee (11.8%, a difference of 0.36%), Immigrants from Czechoslovakia (11.8%, a difference of 0.41%), and Immigrants from Belgium (11.8%, a difference of 0.42%).
| Demographics | Rating | Rank | No Vehicles in Household |
| Ute | 3.3 /100 | #237 | Tragic 11.6% |
| Russians | 3.2 /100 | #238 | Tragic 11.6% |
| Taiwanese | 2.8 /100 | #239 | Tragic 11.7% |
| Immigrants | Immigrants | 2.7 /100 | #240 | Tragic 11.7% |
| Eastern Europeans | 2.7 /100 | #241 | Tragic 11.7% |
| Turks | 2.6 /100 | #242 | Tragic 11.7% |
| Cheyenne | 2.4 /100 | #243 | Tragic 11.7% |
| Immigrants | Portugal | 2.2 /100 | #244 | Tragic 11.7% |
| Immigrants | Honduras | 2.1 /100 | #245 | Tragic 11.8% |
| Menominee | 2.0 /100 | #246 | Tragic 11.8% |
| Immigrants | Czechoslovakia | 2.0 /100 | #247 | Tragic 11.8% |
| Immigrants | Belgium | 1.9 /100 | #248 | Tragic 11.8% |
| Immigrants | Nigeria | 1.9 /100 | #249 | Tragic 11.8% |
| Paiute | 1.8 /100 | #250 | Tragic 11.8% |
| Blacks/African Americans | 1.6 /100 | #251 | Tragic 11.9% |