Serbian vs Dominican 1 or more Vehicles in Household
COMPARE
Serbian
Dominican
1 or more Vehicles in Household
1 or more Vehicles in Household Comparison
Serbians
Dominicans
90.7%
1 OR MORE VEHICLES IN HOUSEHOLD
94.3/ 100
METRIC RATING
115th/ 347
METRIC RANK
70.7%
1 OR MORE VEHICLES IN HOUSEHOLD
0.0/ 100
METRIC RATING
340th/ 347
METRIC RANK
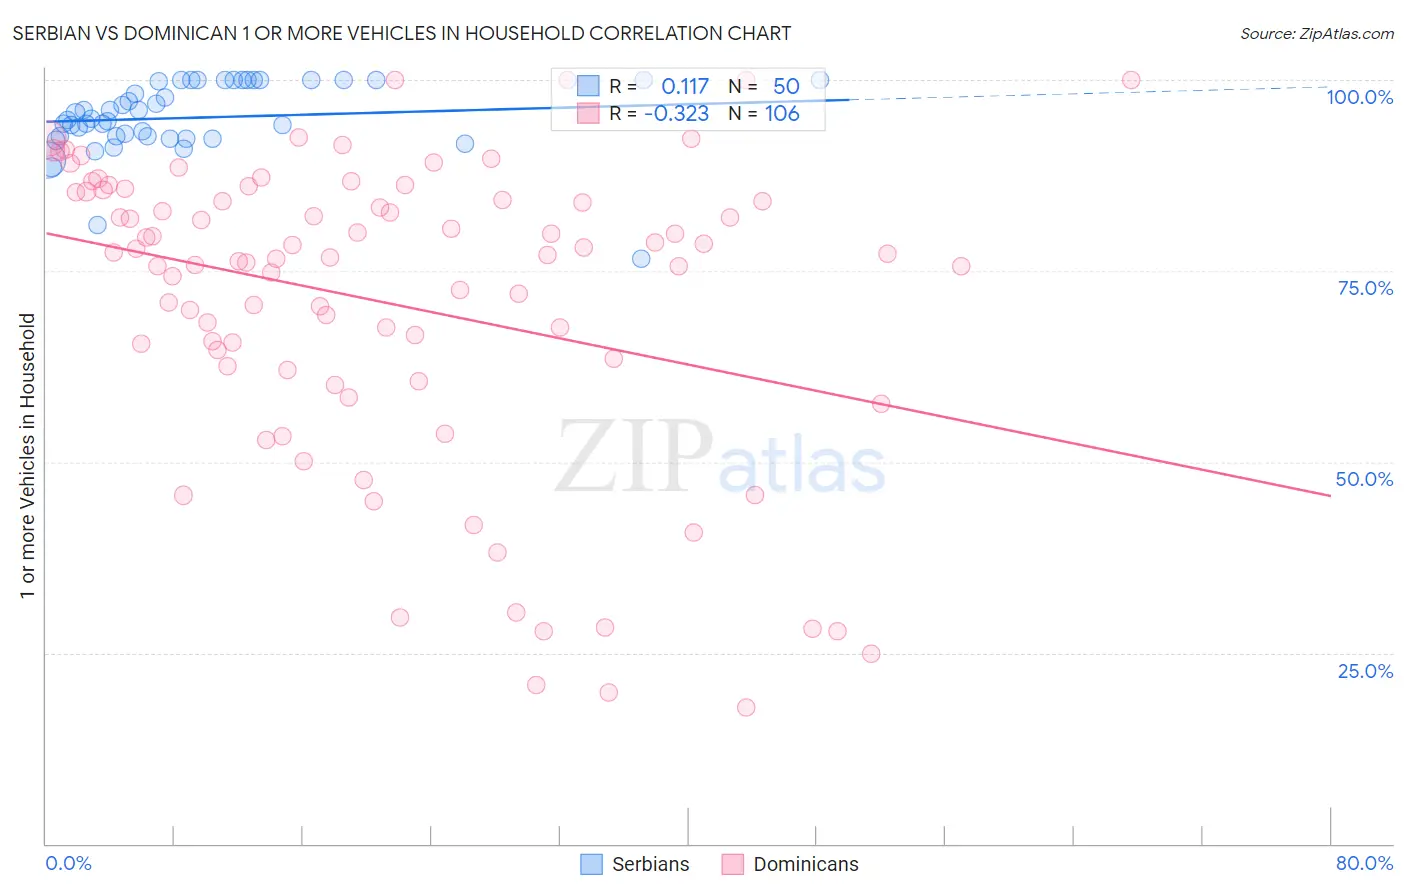
Serbian vs Dominican 1 or more Vehicles in Household Correlation Chart
The statistical analysis conducted on geographies consisting of 267,548,486 people shows a poor positive correlation between the proportion of Serbians and percentage of households with 1 or more vehicles available in the United States with a correlation coefficient (R) of 0.117 and weighted average of 90.7%. Similarly, the statistical analysis conducted on geographies consisting of 354,814,158 people shows a mild negative correlation between the proportion of Dominicans and percentage of households with 1 or more vehicles available in the United States with a correlation coefficient (R) of -0.323 and weighted average of 70.7%, a difference of 28.3%.
1 or more Vehicles in Household Correlation Summary
| Measurement | Serbian | Dominican |
| Minimum | 76.5% | 17.9% |
| Maximum | 100.0% | 100.0% |
| Range | 23.5% | 82.1% |
| Mean | 95.1% | 70.9% |
| Median | 94.8% | 77.0% |
| Interquartile 25% (IQ1) | 92.6% | 62.5% |
| Interquartile 75% (IQ3) | 100.0% | 85.3% |
| Interquartile Range (IQR) | 7.4% | 22.8% |
| Standard Deviation (Sample) | 4.8% | 20.0% |
| Standard Deviation (Population) | 4.8% | 19.9% |
Similar Demographics by 1 or more Vehicles in Household
Demographics Similar to Serbians by 1 or more Vehicles in Household
In terms of 1 or more vehicles in household, the demographic groups most similar to Serbians are Chippewa (90.7%, a difference of 0.0%), Armenian (90.7%, a difference of 0.020%), Immigrants from Kuwait (90.7%, a difference of 0.030%), Greek (90.6%, a difference of 0.050%), and Japanese (90.6%, a difference of 0.060%).
| Demographics | Rating | Rank | 1 or more Vehicles in Household |
| Hispanics or Latinos | 97.6 /100 | #108 | Exceptional 91.0% |
| Delaware | 97.6 /100 | #109 | Exceptional 91.0% |
| Mexican American Indians | 97.4 /100 | #110 | Exceptional 91.0% |
| Navajo | 95.8 /100 | #111 | Exceptional 90.8% |
| Immigrants | Netherlands | 95.7 /100 | #112 | Exceptional 90.8% |
| Immigrants | Kuwait | 94.7 /100 | #113 | Exceptional 90.7% |
| Armenians | 94.5 /100 | #114 | Exceptional 90.7% |
| Serbians | 94.3 /100 | #115 | Exceptional 90.7% |
| Chippewa | 94.3 /100 | #116 | Exceptional 90.7% |
| Greeks | 93.5 /100 | #117 | Exceptional 90.6% |
| Japanese | 93.4 /100 | #118 | Exceptional 90.6% |
| Blackfeet | 92.6 /100 | #119 | Exceptional 90.6% |
| Immigrants | Thailand | 92.3 /100 | #120 | Exceptional 90.6% |
| Icelanders | 92.1 /100 | #121 | Exceptional 90.5% |
| Costa Ricans | 92.0 /100 | #122 | Exceptional 90.5% |
Demographics Similar to Dominicans by 1 or more Vehicles in Household
In terms of 1 or more vehicles in household, the demographic groups most similar to Dominicans are Immigrants from Barbados (70.6%, a difference of 0.13%), Immigrants from Guyana (70.6%, a difference of 0.15%), Guyanese (70.8%, a difference of 0.19%), British West Indian (70.4%, a difference of 0.46%), and Inupiat (71.5%, a difference of 1.2%).
| Demographics | Rating | Rank | 1 or more Vehicles in Household |
| Immigrants | Ecuador | 0.0 /100 | #333 | Tragic 76.2% |
| Immigrants | Bangladesh | 0.0 /100 | #334 | Tragic 74.3% |
| Barbadians | 0.0 /100 | #335 | Tragic 74.0% |
| Vietnamese | 0.0 /100 | #336 | Tragic 73.8% |
| Immigrants | Uzbekistan | 0.0 /100 | #337 | Tragic 73.4% |
| Inupiat | 0.0 /100 | #338 | Tragic 71.5% |
| Guyanese | 0.0 /100 | #339 | Tragic 70.8% |
| Dominicans | 0.0 /100 | #340 | Tragic 70.7% |
| Immigrants | Barbados | 0.0 /100 | #341 | Tragic 70.6% |
| Immigrants | Guyana | 0.0 /100 | #342 | Tragic 70.6% |
| British West Indians | 0.0 /100 | #343 | Tragic 70.4% |
| Immigrants | Dominican Republic | 0.0 /100 | #344 | Tragic 68.6% |
| Immigrants | St. Vincent and the Grenadines | 0.0 /100 | #345 | Tragic 64.7% |
| Immigrants | Grenada | 0.0 /100 | #346 | Tragic 62.7% |
| Yup'ik | 0.0 /100 | #347 | Tragic 58.4% |