Korean vs Romanian 1 or more Vehicles in Household
COMPARE
Korean
Romanian
1 or more Vehicles in Household
1 or more Vehicles in Household Comparison
Koreans
Romanians
92.1%
1 OR MORE VEHICLES IN HOUSEHOLD
99.9/ 100
METRIC RATING
52nd/ 347
METRIC RANK
89.2%
1 OR MORE VEHICLES IN HOUSEHOLD
18.2/ 100
METRIC RATING
204th/ 347
METRIC RANK
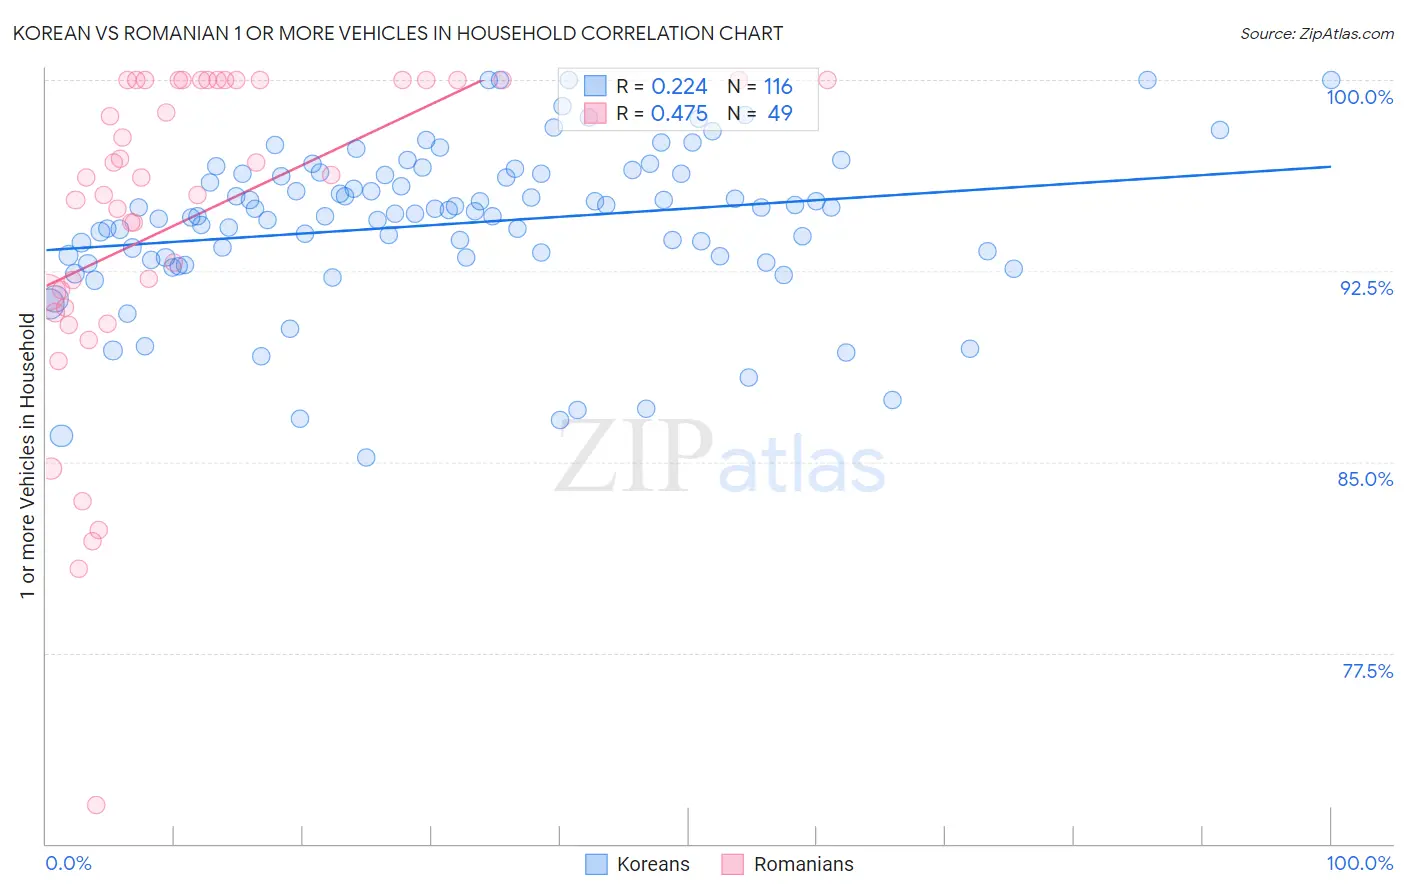
Korean vs Romanian 1 or more Vehicles in Household Correlation Chart
The statistical analysis conducted on geographies consisting of 510,490,681 people shows a weak positive correlation between the proportion of Koreans and percentage of households with 1 or more vehicles available in the United States with a correlation coefficient (R) of 0.224 and weighted average of 92.1%. Similarly, the statistical analysis conducted on geographies consisting of 377,747,936 people shows a moderate positive correlation between the proportion of Romanians and percentage of households with 1 or more vehicles available in the United States with a correlation coefficient (R) of 0.475 and weighted average of 89.2%, a difference of 3.3%.
1 or more Vehicles in Household Correlation Summary
| Measurement | Korean | Romanian |
| Minimum | 85.2% | 71.5% |
| Maximum | 100.0% | 100.0% |
| Range | 14.8% | 28.5% |
| Mean | 94.3% | 94.5% |
| Median | 94.8% | 96.2% |
| Interquartile 25% (IQ1) | 93.0% | 91.4% |
| Interquartile 75% (IQ3) | 96.3% | 100.0% |
| Interquartile Range (IQR) | 3.3% | 8.6% |
| Standard Deviation (Sample) | 3.1% | 6.4% |
| Standard Deviation (Population) | 3.1% | 6.3% |
Similar Demographics by 1 or more Vehicles in Household
Demographics Similar to Koreans by 1 or more Vehicles in Household
In terms of 1 or more vehicles in household, the demographic groups most similar to Koreans are Celtic (92.1%, a difference of 0.030%), Hawaiian (92.0%, a difference of 0.030%), Guamanian/Chamorro (92.1%, a difference of 0.040%), Slovene (92.0%, a difference of 0.040%), and Afghan (92.1%, a difference of 0.050%).
| Demographics | Rating | Rank | 1 or more Vehicles in Household |
| Immigrants | Nonimmigrants | 99.9 /100 | #45 | Exceptional 92.2% |
| Immigrants | Fiji | 99.9 /100 | #46 | Exceptional 92.2% |
| Northern Europeans | 99.9 /100 | #47 | Exceptional 92.2% |
| Belgians | 99.9 /100 | #48 | Exceptional 92.1% |
| Afghans | 99.9 /100 | #49 | Exceptional 92.1% |
| Guamanians/Chamorros | 99.9 /100 | #50 | Exceptional 92.1% |
| Celtics | 99.9 /100 | #51 | Exceptional 92.1% |
| Koreans | 99.9 /100 | #52 | Exceptional 92.1% |
| Hawaiians | 99.9 /100 | #53 | Exceptional 92.0% |
| Slovenes | 99.9 /100 | #54 | Exceptional 92.0% |
| Immigrants | Afghanistan | 99.9 /100 | #55 | Exceptional 92.0% |
| Immigrants | Venezuela | 99.9 /100 | #56 | Exceptional 92.0% |
| Iraqis | 99.8 /100 | #57 | Exceptional 91.9% |
| Immigrants | Mexico | 99.8 /100 | #58 | Exceptional 91.9% |
| Venezuelans | 99.8 /100 | #59 | Exceptional 91.9% |
Demographics Similar to Romanians by 1 or more Vehicles in Household
In terms of 1 or more vehicles in household, the demographic groups most similar to Romanians are Guatemalan (89.2%, a difference of 0.010%), Cambodian (89.2%, a difference of 0.020%), Iroquois (89.2%, a difference of 0.040%), Immigrants from Western Europe (89.2%, a difference of 0.060%), and Apache (89.1%, a difference of 0.060%).
| Demographics | Rating | Rank | 1 or more Vehicles in Household |
| Immigrants | Sweden | 23.6 /100 | #197 | Fair 89.3% |
| Pennsylvania Germans | 22.9 /100 | #198 | Fair 89.3% |
| Immigrants | Asia | 22.8 /100 | #199 | Fair 89.3% |
| Central Americans | 21.4 /100 | #200 | Fair 89.2% |
| Immigrants | Western Europe | 20.5 /100 | #201 | Fair 89.2% |
| Iroquois | 19.8 /100 | #202 | Poor 89.2% |
| Cambodians | 18.9 /100 | #203 | Poor 89.2% |
| Romanians | 18.2 /100 | #204 | Poor 89.2% |
| Guatemalans | 17.8 /100 | #205 | Poor 89.2% |
| Apache | 16.2 /100 | #206 | Poor 89.1% |
| Immigrants | Denmark | 14.8 /100 | #207 | Poor 89.1% |
| Immigrants | Chile | 14.4 /100 | #208 | Poor 89.1% |
| Immigrants | Italy | 14.0 /100 | #209 | Poor 89.1% |
| Dutch West Indians | 13.5 /100 | #210 | Poor 89.0% |
| Sierra Leoneans | 13.0 /100 | #211 | Poor 89.0% |