Immigrants from Scotland vs Immigrants from South Central Asia No Vehicles in Household
COMPARE
Immigrants from Scotland
Immigrants from South Central Asia
No Vehicles in Household
No Vehicles in Household Comparison
Immigrants from Scotland
Immigrants from South Central Asia
8.3%
NO VEHICLES IN HOUSEHOLD
99.7/ 100
METRIC RATING
67th/ 347
METRIC RANK
8.6%
NO VEHICLES IN HOUSEHOLD
99.5/ 100
METRIC RATING
78th/ 347
METRIC RANK
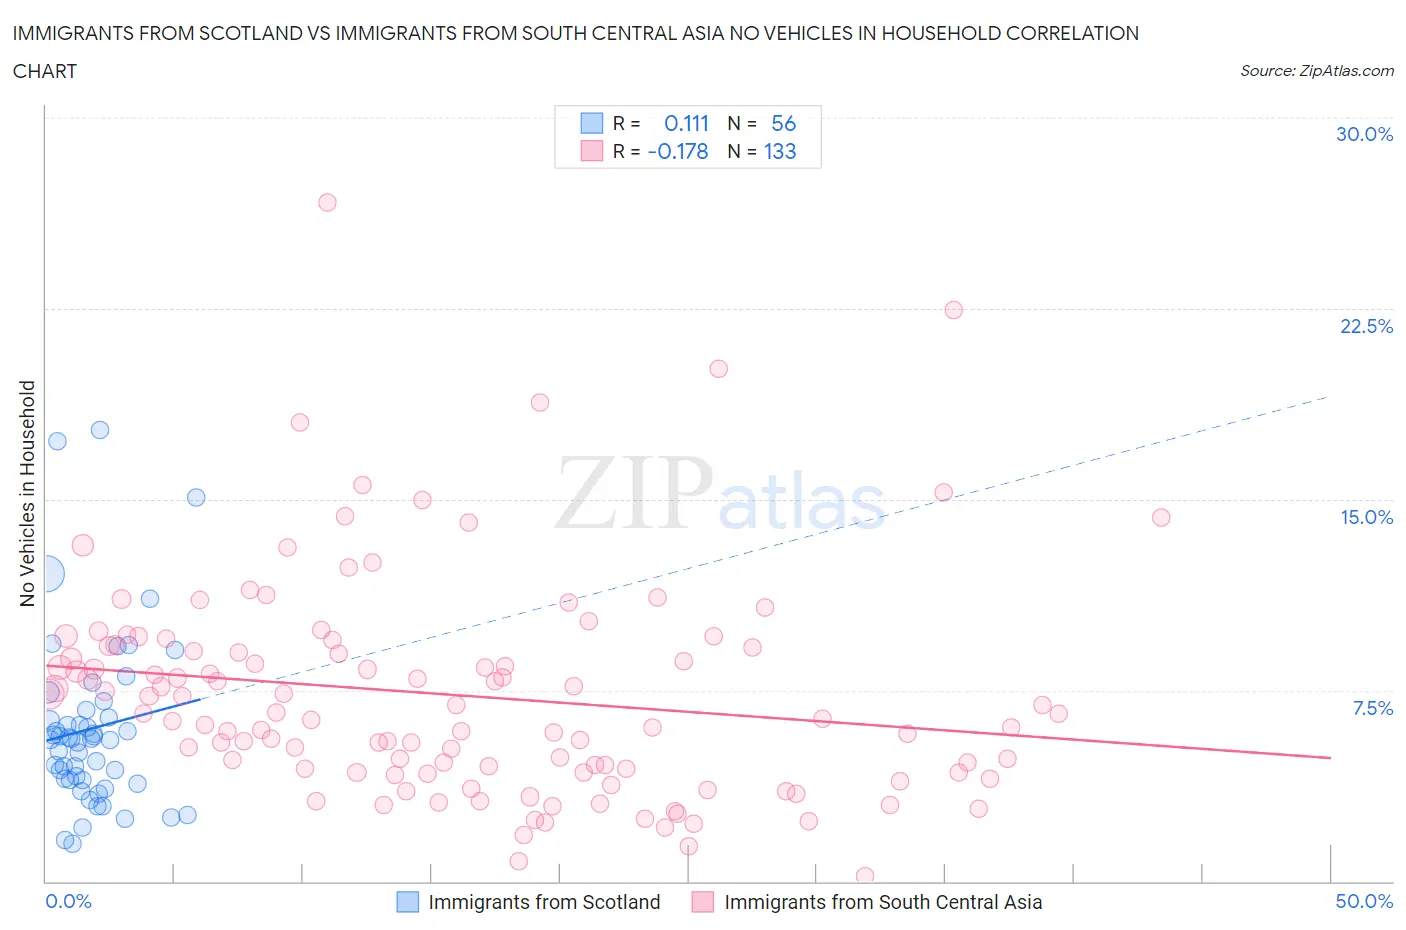
Immigrants from Scotland vs Immigrants from South Central Asia No Vehicles in Household Correlation Chart
The statistical analysis conducted on geographies consisting of 196,071,616 people shows a poor positive correlation between the proportion of Immigrants from Scotland and percentage of households with no vehicle available in the United States with a correlation coefficient (R) of 0.111 and weighted average of 8.3%. Similarly, the statistical analysis conducted on geographies consisting of 458,042,112 people shows a poor negative correlation between the proportion of Immigrants from South Central Asia and percentage of households with no vehicle available in the United States with a correlation coefficient (R) of -0.178 and weighted average of 8.6%, a difference of 2.8%.
No Vehicles in Household Correlation Summary
| Measurement | Immigrants from Scotland | Immigrants from South Central Asia |
| Minimum | 1.4% | 0.21% |
| Maximum | 17.7% | 26.7% |
| Range | 16.3% | 26.4% |
| Mean | 6.0% | 7.3% |
| Median | 5.6% | 6.6% |
| Interquartile 25% (IQ1) | 4.0% | 4.3% |
| Interquartile 75% (IQ3) | 6.6% | 9.2% |
| Interquartile Range (IQR) | 2.6% | 4.9% |
| Standard Deviation (Sample) | 3.4% | 4.3% |
| Standard Deviation (Population) | 3.4% | 4.3% |
Demographics Similar to Immigrants from Scotland and Immigrants from South Central Asia by No Vehicles in Household
In terms of no vehicles in household, the demographic groups most similar to Immigrants from Scotland are Palestinian (8.3%, a difference of 0.010%), Canadian (8.3%, a difference of 0.12%), Immigrants from Iran (8.4%, a difference of 0.40%), Spaniard (8.4%, a difference of 0.45%), and Croatian (8.3%, a difference of 0.87%). Similarly, the demographic groups most similar to Immigrants from South Central Asia are Portuguese (8.6%, a difference of 0.060%), Iranian (8.6%, a difference of 0.12%), Bolivian (8.6%, a difference of 0.20%), Immigrants from Philippines (8.5%, a difference of 0.21%), and Tsimshian (8.6%, a difference of 0.26%).
| Demographics | Rating | Rank | No Vehicles in Household |
| Chinese | 99.8 /100 | #62 | Exceptional 8.2% |
| Slovaks | 99.8 /100 | #63 | Exceptional 8.3% |
| Croatians | 99.8 /100 | #64 | Exceptional 8.3% |
| Canadians | 99.7 /100 | #65 | Exceptional 8.3% |
| Palestinians | 99.7 /100 | #66 | Exceptional 8.3% |
| Immigrants | Scotland | 99.7 /100 | #67 | Exceptional 8.3% |
| Immigrants | Iran | 99.7 /100 | #68 | Exceptional 8.4% |
| Spaniards | 99.7 /100 | #69 | Exceptional 8.4% |
| Cajuns | 99.6 /100 | #70 | Exceptional 8.4% |
| Immigrants | Lebanon | 99.6 /100 | #71 | Exceptional 8.4% |
| Lithuanians | 99.6 /100 | #72 | Exceptional 8.4% |
| Poles | 99.6 /100 | #73 | Exceptional 8.4% |
| Cubans | 99.5 /100 | #74 | Exceptional 8.5% |
| Jordanians | 99.5 /100 | #75 | Exceptional 8.5% |
| Immigrants | Philippines | 99.5 /100 | #76 | Exceptional 8.5% |
| Iranians | 99.5 /100 | #77 | Exceptional 8.6% |
| Immigrants | South Central Asia | 99.5 /100 | #78 | Exceptional 8.6% |
| Portuguese | 99.5 /100 | #79 | Exceptional 8.6% |
| Bolivians | 99.4 /100 | #80 | Exceptional 8.6% |
| Tsimshian | 99.4 /100 | #81 | Exceptional 8.6% |
| Immigrants | South Eastern Asia | 99.4 /100 | #82 | Exceptional 8.6% |