Immigrants from Lithuania vs Cambodian 1 or more Vehicles in Household
COMPARE
Immigrants from Lithuania
Cambodian
1 or more Vehicles in Household
1 or more Vehicles in Household Comparison
Immigrants from Lithuania
Cambodians
90.2%
1 OR MORE VEHICLES IN HOUSEHOLD
83.0/ 100
METRIC RATING
142nd/ 347
METRIC RANK
89.2%
1 OR MORE VEHICLES IN HOUSEHOLD
18.9/ 100
METRIC RATING
203rd/ 347
METRIC RANK
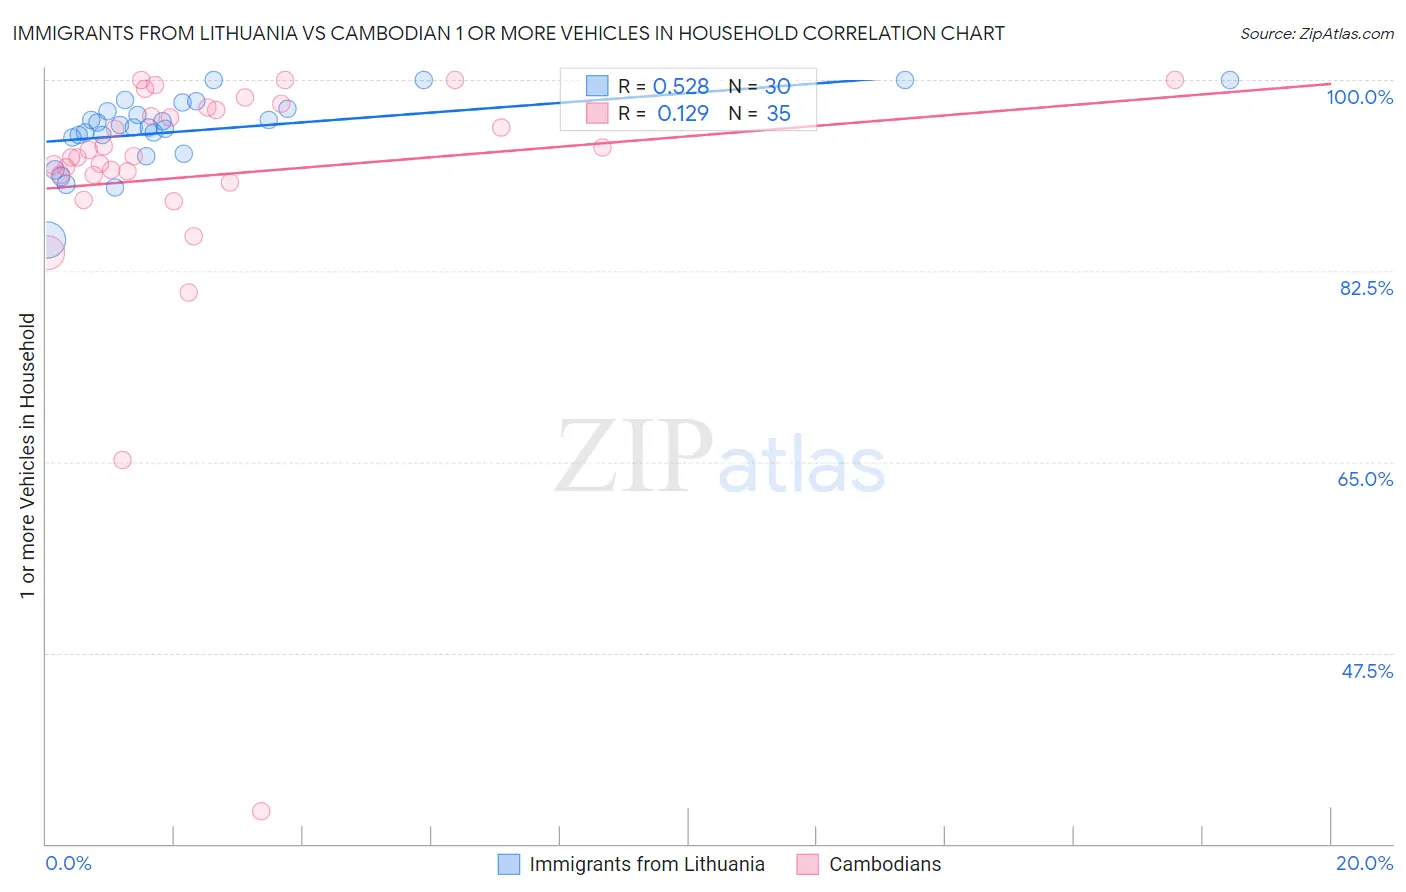
Immigrants from Lithuania vs Cambodian 1 or more Vehicles in Household Correlation Chart
The statistical analysis conducted on geographies consisting of 117,713,976 people shows a substantial positive correlation between the proportion of Immigrants from Lithuania and percentage of households with 1 or more vehicles available in the United States with a correlation coefficient (R) of 0.528 and weighted average of 90.2%. Similarly, the statistical analysis conducted on geographies consisting of 102,492,844 people shows a poor positive correlation between the proportion of Cambodians and percentage of households with 1 or more vehicles available in the United States with a correlation coefficient (R) of 0.129 and weighted average of 89.2%, a difference of 1.2%.
1 or more Vehicles in Household Correlation Summary
| Measurement | Immigrants from Lithuania | Cambodian |
| Minimum | 85.3% | 33.0% |
| Maximum | 100.0% | 100.0% |
| Range | 14.7% | 67.0% |
| Mean | 95.4% | 91.3% |
| Median | 95.8% | 93.0% |
| Interquartile 25% (IQ1) | 94.8% | 91.3% |
| Interquartile 75% (IQ3) | 97.4% | 97.5% |
| Interquartile Range (IQR) | 2.6% | 6.2% |
| Standard Deviation (Sample) | 3.3% | 12.2% |
| Standard Deviation (Population) | 3.2% | 12.0% |
Similar Demographics by 1 or more Vehicles in Household
Demographics Similar to Immigrants from Lithuania by 1 or more Vehicles in Household
In terms of 1 or more vehicles in household, the demographic groups most similar to Immigrants from Lithuania are Immigrants from Moldova (90.2%, a difference of 0.0%), Immigrants from Bahamas (90.2%, a difference of 0.040%), Immigrants from Zimbabwe (90.2%, a difference of 0.040%), Sioux (90.2%, a difference of 0.040%), and Sudanese (90.3%, a difference of 0.060%).
| Demographics | Rating | Rank | 1 or more Vehicles in Household |
| Immigrants | Oceania | 86.9 /100 | #135 | Excellent 90.4% |
| Hungarians | 86.5 /100 | #136 | Excellent 90.3% |
| Latvians | 86.3 /100 | #137 | Excellent 90.3% |
| Syrians | 86.3 /100 | #138 | Excellent 90.3% |
| Estonians | 85.6 /100 | #139 | Excellent 90.3% |
| Sudanese | 85.2 /100 | #140 | Excellent 90.3% |
| Immigrants | Moldova | 83.1 /100 | #141 | Excellent 90.2% |
| Immigrants | Lithuania | 83.0 /100 | #142 | Excellent 90.2% |
| Immigrants | Bahamas | 81.5 /100 | #143 | Excellent 90.2% |
| Immigrants | Zimbabwe | 81.5 /100 | #144 | Excellent 90.2% |
| Sioux | 81.3 /100 | #145 | Excellent 90.2% |
| Bahamians | 80.5 /100 | #146 | Excellent 90.2% |
| Chileans | 79.8 /100 | #147 | Good 90.2% |
| Immigrants | Eastern Africa | 78.2 /100 | #148 | Good 90.1% |
| Immigrants | Nicaragua | 76.7 /100 | #149 | Good 90.1% |
Demographics Similar to Cambodians by 1 or more Vehicles in Household
In terms of 1 or more vehicles in household, the demographic groups most similar to Cambodians are Iroquois (89.2%, a difference of 0.020%), Romanian (89.2%, a difference of 0.020%), Guatemalan (89.2%, a difference of 0.030%), Immigrants from Western Europe (89.2%, a difference of 0.040%), and Central American (89.2%, a difference of 0.060%).
| Demographics | Rating | Rank | 1 or more Vehicles in Household |
| Crow | 24.3 /100 | #196 | Fair 89.3% |
| Immigrants | Sweden | 23.6 /100 | #197 | Fair 89.3% |
| Pennsylvania Germans | 22.9 /100 | #198 | Fair 89.3% |
| Immigrants | Asia | 22.8 /100 | #199 | Fair 89.3% |
| Central Americans | 21.4 /100 | #200 | Fair 89.2% |
| Immigrants | Western Europe | 20.5 /100 | #201 | Fair 89.2% |
| Iroquois | 19.8 /100 | #202 | Poor 89.2% |
| Cambodians | 18.9 /100 | #203 | Poor 89.2% |
| Romanians | 18.2 /100 | #204 | Poor 89.2% |
| Guatemalans | 17.8 /100 | #205 | Poor 89.2% |
| Apache | 16.2 /100 | #206 | Poor 89.1% |
| Immigrants | Denmark | 14.8 /100 | #207 | Poor 89.1% |
| Immigrants | Chile | 14.4 /100 | #208 | Poor 89.1% |
| Immigrants | Italy | 14.0 /100 | #209 | Poor 89.1% |
| Dutch West Indians | 13.5 /100 | #210 | Poor 89.0% |