Immigrants from Iraq vs Cherokee No Vehicles in Household
COMPARE
Immigrants from Iraq
Cherokee
No Vehicles in Household
No Vehicles in Household Comparison
Immigrants from Iraq
Cherokee
7.5%
NO VEHICLES IN HOUSEHOLD
100.0/ 100
METRIC RATING
24th/ 347
METRIC RANK
7.7%
NO VEHICLES IN HOUSEHOLD
99.9/ 100
METRIC RATING
35th/ 347
METRIC RANK
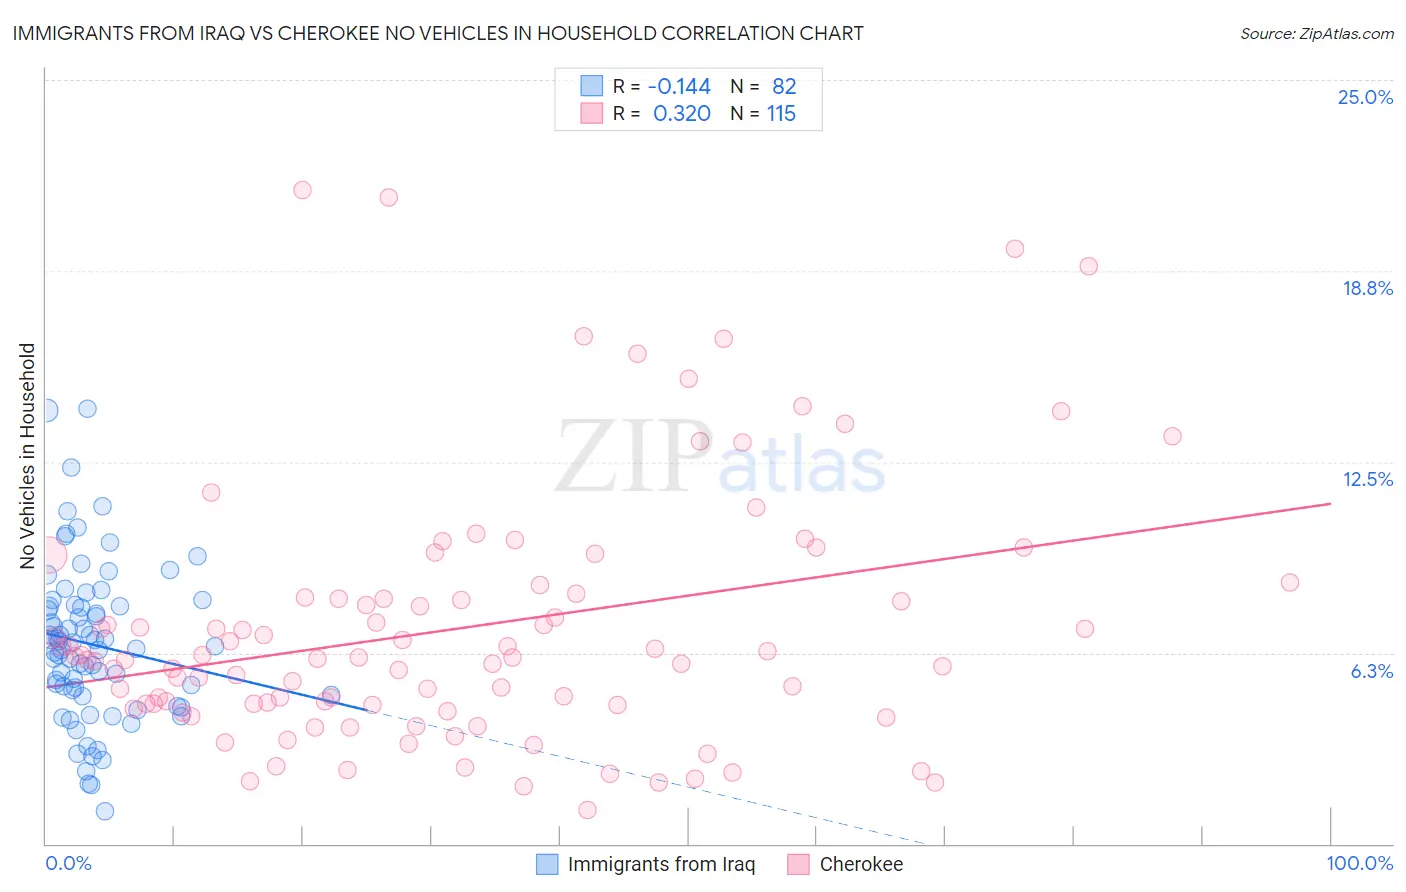
Immigrants from Iraq vs Cherokee No Vehicles in Household Correlation Chart
The statistical analysis conducted on geographies consisting of 194,632,340 people shows a poor negative correlation between the proportion of Immigrants from Iraq and percentage of households with no vehicle available in the United States with a correlation coefficient (R) of -0.144 and weighted average of 7.5%. Similarly, the statistical analysis conducted on geographies consisting of 491,425,453 people shows a mild positive correlation between the proportion of Cherokee and percentage of households with no vehicle available in the United States with a correlation coefficient (R) of 0.320 and weighted average of 7.7%, a difference of 3.6%.
No Vehicles in Household Correlation Summary
| Measurement | Immigrants from Iraq | Cherokee |
| Minimum | 1.1% | 1.1% |
| Maximum | 14.2% | 21.4% |
| Range | 13.2% | 20.3% |
| Mean | 6.5% | 7.1% |
| Median | 6.4% | 6.1% |
| Interquartile 25% (IQ1) | 4.9% | 4.5% |
| Interquartile 75% (IQ3) | 7.8% | 8.1% |
| Interquartile Range (IQR) | 2.9% | 3.5% |
| Standard Deviation (Sample) | 2.6% | 4.2% |
| Standard Deviation (Population) | 2.5% | 4.1% |
Demographics Similar to Immigrants from Iraq and Cherokee by No Vehicles in Household
In terms of no vehicles in household, the demographic groups most similar to Immigrants from Iraq are Yaqui (7.5%, a difference of 0.16%), French (7.4%, a difference of 0.39%), Irish (7.4%, a difference of 0.44%), Nepalese (7.4%, a difference of 1.0%), and Ottawa (7.4%, a difference of 1.2%). Similarly, the demographic groups most similar to Cherokee are Iraqi (7.7%, a difference of 0.13%), Immigrants from Vietnam (7.7%, a difference of 0.14%), Immigrants from Taiwan (7.7%, a difference of 0.27%), Malaysian (7.7%, a difference of 0.38%), and Basque (7.8%, a difference of 0.39%).
| Demographics | Rating | Rank | No Vehicles in Household |
| Arapaho | 100.0 /100 | #19 | Exceptional 7.4% |
| Ottawa | 100.0 /100 | #20 | Exceptional 7.4% |
| Nepalese | 100.0 /100 | #21 | Exceptional 7.4% |
| Irish | 100.0 /100 | #22 | Exceptional 7.4% |
| French | 100.0 /100 | #23 | Exceptional 7.4% |
| Immigrants | Iraq | 100.0 /100 | #24 | Exceptional 7.5% |
| Yaqui | 100.0 /100 | #25 | Exceptional 7.5% |
| Sri Lankans | 100.0 /100 | #26 | Exceptional 7.6% |
| British | 100.0 /100 | #27 | Exceptional 7.6% |
| Samoans | 100.0 /100 | #28 | Exceptional 7.6% |
| Americans | 100.0 /100 | #29 | Exceptional 7.7% |
| Finns | 100.0 /100 | #30 | Exceptional 7.7% |
| Native Hawaiians | 100.0 /100 | #31 | Exceptional 7.7% |
| Malaysians | 100.0 /100 | #32 | Exceptional 7.7% |
| Immigrants | Taiwan | 100.0 /100 | #33 | Exceptional 7.7% |
| Immigrants | Vietnam | 100.0 /100 | #34 | Exceptional 7.7% |
| Cherokee | 99.9 /100 | #35 | Exceptional 7.7% |
| Iraqis | 99.9 /100 | #36 | Exceptional 7.7% |
| Basques | 99.9 /100 | #37 | Exceptional 7.8% |
| Creek | 99.9 /100 | #38 | Exceptional 7.8% |
| Immigrants | Fiji | 99.9 /100 | #39 | Exceptional 7.8% |