Immigrants from El Salvador vs Central American Indian No Vehicles in Household
COMPARE
Immigrants from El Salvador
Central American Indian
No Vehicles in Household
No Vehicles in Household Comparison
Immigrants from El Salvador
Central American Indians
10.4%
NO VEHICLES IN HOUSEHOLD
49.1/ 100
METRIC RATING
177th/ 347
METRIC RANK
13.3%
NO VEHICLES IN HOUSEHOLD
0.0/ 100
METRIC RATING
281st/ 347
METRIC RANK
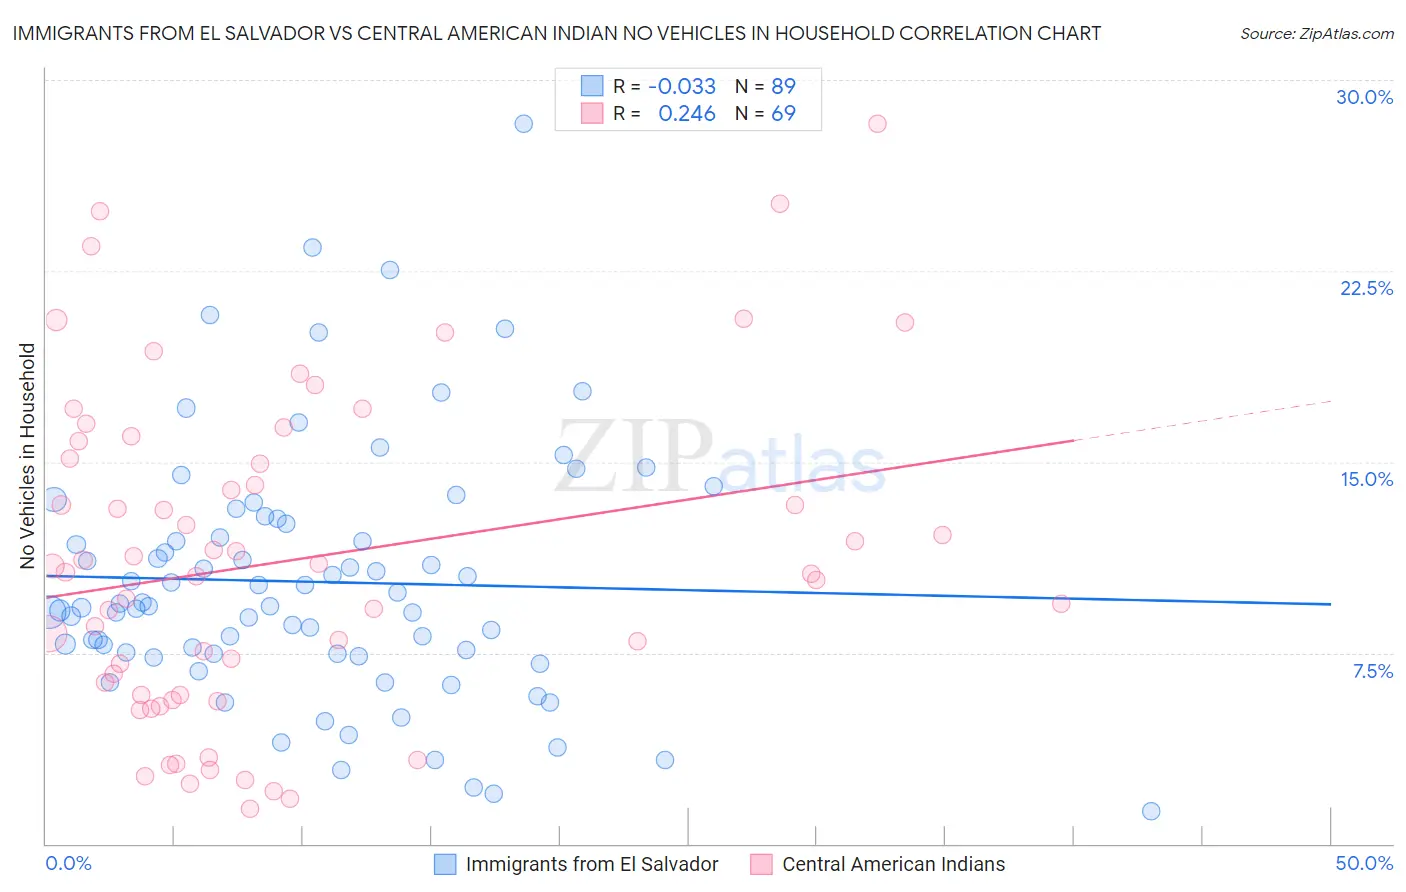
Immigrants from El Salvador vs Central American Indian No Vehicles in Household Correlation Chart
The statistical analysis conducted on geographies consisting of 357,255,745 people shows no correlation between the proportion of Immigrants from El Salvador and percentage of households with no vehicle available in the United States with a correlation coefficient (R) of -0.033 and weighted average of 10.4%. Similarly, the statistical analysis conducted on geographies consisting of 325,699,526 people shows a weak positive correlation between the proportion of Central American Indians and percentage of households with no vehicle available in the United States with a correlation coefficient (R) of 0.246 and weighted average of 13.3%, a difference of 28.1%.
No Vehicles in Household Correlation Summary
| Measurement | Immigrants from El Salvador | Central American Indian |
| Minimum | 1.3% | 1.4% |
| Maximum | 28.3% | 28.3% |
| Range | 27.0% | 26.9% |
| Mean | 10.3% | 11.1% |
| Median | 9.3% | 10.7% |
| Interquartile 25% (IQ1) | 7.4% | 5.8% |
| Interquartile 75% (IQ3) | 12.7% | 15.5% |
| Interquartile Range (IQR) | 5.2% | 9.6% |
| Standard Deviation (Sample) | 4.9% | 6.4% |
| Standard Deviation (Population) | 4.9% | 6.3% |
Similar Demographics by No Vehicles in Household
Demographics Similar to Immigrants from El Salvador by No Vehicles in Household
In terms of no vehicles in household, the demographic groups most similar to Immigrants from El Salvador are Immigrants from Burma/Myanmar (10.4%, a difference of 0.010%), French American Indian (10.4%, a difference of 0.010%), Immigrants from Sudan (10.4%, a difference of 0.13%), Filipino (10.4%, a difference of 0.14%), and Immigrants from Ethiopia (10.4%, a difference of 0.15%).
| Demographics | Rating | Rank | No Vehicles in Household |
| Immigrants | Latin America | 53.2 /100 | #170 | Average 10.4% |
| Hmong | 52.7 /100 | #171 | Average 10.4% |
| Brazilians | 51.7 /100 | #172 | Average 10.4% |
| Filipinos | 50.1 /100 | #173 | Average 10.4% |
| Immigrants | Sudan | 50.0 /100 | #174 | Average 10.4% |
| Immigrants | Burma/Myanmar | 49.1 /100 | #175 | Average 10.4% |
| French American Indians | 49.1 /100 | #176 | Average 10.4% |
| Immigrants | El Salvador | 49.1 /100 | #177 | Average 10.4% |
| Immigrants | Ethiopia | 48.0 /100 | #178 | Average 10.4% |
| Ethiopians | 45.8 /100 | #179 | Average 10.5% |
| Arabs | 45.3 /100 | #180 | Average 10.5% |
| Immigrants | Colombia | 44.1 /100 | #181 | Average 10.5% |
| Immigrants | Bulgaria | 43.8 /100 | #182 | Average 10.5% |
| Natives/Alaskans | 43.7 /100 | #183 | Average 10.5% |
| Immigrants | Nepal | 42.4 /100 | #184 | Average 10.5% |
Demographics Similar to Central American Indians by No Vehicles in Household
In terms of no vehicles in household, the demographic groups most similar to Central American Indians are Alsatian (13.2%, a difference of 1.4%), Immigrants from Eastern Asia (13.5%, a difference of 1.5%), Immigrants from Kazakhstan (13.6%, a difference of 1.5%), Mongolian (13.1%, a difference of 1.7%), and Immigrants from Malaysia (13.6%, a difference of 1.8%).
| Demographics | Rating | Rank | No Vehicles in Household |
| Immigrants | Singapore | 0.1 /100 | #274 | Tragic 12.9% |
| Immigrants | Albania | 0.1 /100 | #275 | Tragic 13.0% |
| Immigrants | Southern Europe | 0.1 /100 | #276 | Tragic 13.0% |
| Aleuts | 0.1 /100 | #277 | Tragic 13.0% |
| Immigrants | Croatia | 0.1 /100 | #278 | Tragic 13.0% |
| Mongolians | 0.0 /100 | #279 | Tragic 13.1% |
| Alsatians | 0.0 /100 | #280 | Tragic 13.2% |
| Central American Indians | 0.0 /100 | #281 | Tragic 13.3% |
| Immigrants | Eastern Asia | 0.0 /100 | #282 | Tragic 13.5% |
| Immigrants | Kazakhstan | 0.0 /100 | #283 | Tragic 13.6% |
| Immigrants | Malaysia | 0.0 /100 | #284 | Tragic 13.6% |
| Immigrants | Eastern Europe | 0.0 /100 | #285 | Tragic 13.6% |
| Colville | 0.0 /100 | #286 | Tragic 13.7% |
| Immigrants | Ireland | 0.0 /100 | #287 | Tragic 13.7% |
| Hopi | 0.0 /100 | #288 | Tragic 13.7% |