Immigrants from Egypt vs Irish No Vehicles in Household
COMPARE
Immigrants from Egypt
Irish
No Vehicles in Household
No Vehicles in Household Comparison
Immigrants from Egypt
Irish
12.2%
NO VEHICLES IN HOUSEHOLD
0.6/ 100
METRIC RATING
263rd/ 347
METRIC RANK
7.4%
NO VEHICLES IN HOUSEHOLD
100.0/ 100
METRIC RATING
22nd/ 347
METRIC RANK
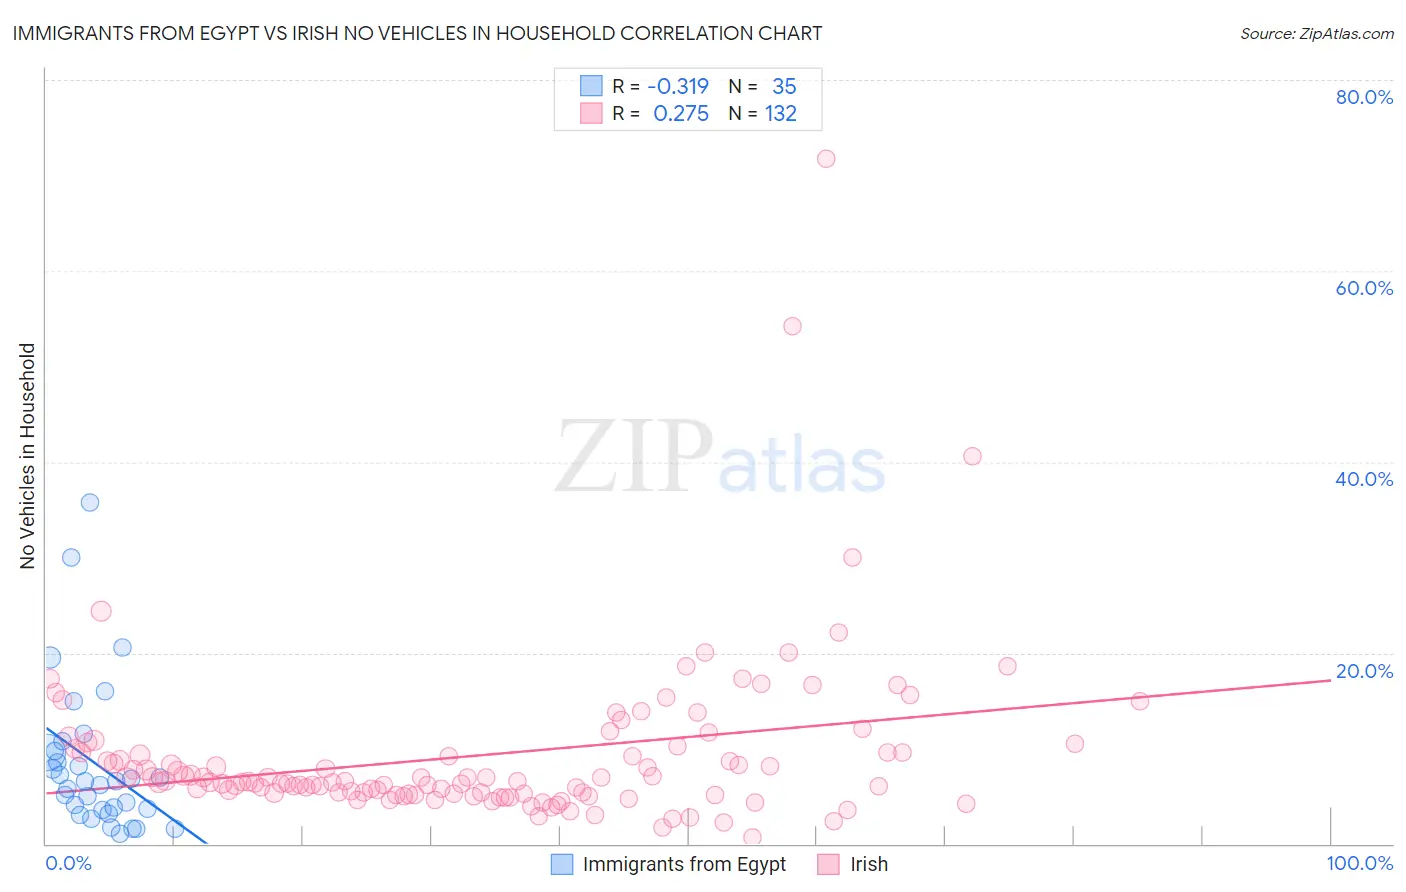
Immigrants from Egypt vs Irish No Vehicles in Household Correlation Chart
The statistical analysis conducted on geographies consisting of 245,144,275 people shows a mild negative correlation between the proportion of Immigrants from Egypt and percentage of households with no vehicle available in the United States with a correlation coefficient (R) of -0.319 and weighted average of 12.2%. Similarly, the statistical analysis conducted on geographies consisting of 573,311,233 people shows a weak positive correlation between the proportion of Irish and percentage of households with no vehicle available in the United States with a correlation coefficient (R) of 0.275 and weighted average of 7.4%, a difference of 64.5%.
No Vehicles in Household Correlation Summary
| Measurement | Immigrants from Egypt | Irish |
| Minimum | 1.1% | 0.63% |
| Maximum | 35.7% | 71.7% |
| Range | 34.6% | 71.1% |
| Mean | 8.4% | 9.3% |
| Median | 6.5% | 6.5% |
| Interquartile 25% (IQ1) | 3.6% | 5.3% |
| Interquartile 75% (IQ3) | 9.7% | 9.8% |
| Interquartile Range (IQR) | 6.2% | 4.5% |
| Standard Deviation (Sample) | 7.8% | 8.8% |
| Standard Deviation (Population) | 7.7% | 8.8% |
Similar Demographics by No Vehicles in Household
Demographics Similar to Immigrants from Egypt by No Vehicles in Household
In terms of no vehicles in household, the demographic groups most similar to Immigrants from Egypt are Immigrants from Liberia (12.2%, a difference of 0.15%), Subsaharan African (12.2%, a difference of 0.22%), Immigrants from Switzerland (12.3%, a difference of 0.46%), Macedonian (12.2%, a difference of 0.61%), and African (12.3%, a difference of 0.71%).
| Demographics | Rating | Rank | No Vehicles in Household |
| Liberians | 1.2 /100 | #256 | Tragic 12.0% |
| Nigerians | 0.9 /100 | #257 | Tragic 12.1% |
| South American Indians | 0.9 /100 | #258 | Tragic 12.1% |
| Immigrants | Latvia | 0.8 /100 | #259 | Tragic 12.1% |
| Macedonians | 0.7 /100 | #260 | Tragic 12.2% |
| Sub-Saharan Africans | 0.6 /100 | #261 | Tragic 12.2% |
| Immigrants | Liberia | 0.6 /100 | #262 | Tragic 12.2% |
| Immigrants | Egypt | 0.6 /100 | #263 | Tragic 12.2% |
| Immigrants | Switzerland | 0.5 /100 | #264 | Tragic 12.3% |
| Africans | 0.4 /100 | #265 | Tragic 12.3% |
| Israelis | 0.3 /100 | #266 | Tragic 12.4% |
| Immigrants | Europe | 0.3 /100 | #267 | Tragic 12.5% |
| Immigrants | Africa | 0.2 /100 | #268 | Tragic 12.5% |
| Panamanians | 0.2 /100 | #269 | Tragic 12.5% |
| Immigrants | Northern Africa | 0.2 /100 | #270 | Tragic 12.6% |
Demographics Similar to Irish by No Vehicles in Household
In terms of no vehicles in household, the demographic groups most similar to Irish are French (7.4%, a difference of 0.050%), Immigrants from Iraq (7.5%, a difference of 0.44%), Nepalese (7.4%, a difference of 0.60%), Yaqui (7.5%, a difference of 0.61%), and Ottawa (7.4%, a difference of 0.75%).
| Demographics | Rating | Rank | No Vehicles in Household |
| Whites/Caucasians | 100.0 /100 | #15 | Exceptional 7.0% |
| Europeans | 100.0 /100 | #16 | Exceptional 7.1% |
| Welsh | 100.0 /100 | #17 | Exceptional 7.2% |
| Tongans | 100.0 /100 | #18 | Exceptional 7.2% |
| Arapaho | 100.0 /100 | #19 | Exceptional 7.4% |
| Ottawa | 100.0 /100 | #20 | Exceptional 7.4% |
| Nepalese | 100.0 /100 | #21 | Exceptional 7.4% |
| Irish | 100.0 /100 | #22 | Exceptional 7.4% |
| French | 100.0 /100 | #23 | Exceptional 7.4% |
| Immigrants | Iraq | 100.0 /100 | #24 | Exceptional 7.5% |
| Yaqui | 100.0 /100 | #25 | Exceptional 7.5% |
| Sri Lankans | 100.0 /100 | #26 | Exceptional 7.6% |
| British | 100.0 /100 | #27 | Exceptional 7.6% |
| Samoans | 100.0 /100 | #28 | Exceptional 7.6% |
| Americans | 100.0 /100 | #29 | Exceptional 7.7% |