Immigrants from Chile vs Iranian 1 or more Vehicles in Household
COMPARE
Immigrants from Chile
Iranian
1 or more Vehicles in Household
1 or more Vehicles in Household Comparison
Immigrants from Chile
Iranians
89.1%
1 OR MORE VEHICLES IN HOUSEHOLD
14.4/ 100
METRIC RATING
208th/ 347
METRIC RANK
91.5%
1 OR MORE VEHICLES IN HOUSEHOLD
99.4/ 100
METRIC RATING
78th/ 347
METRIC RANK
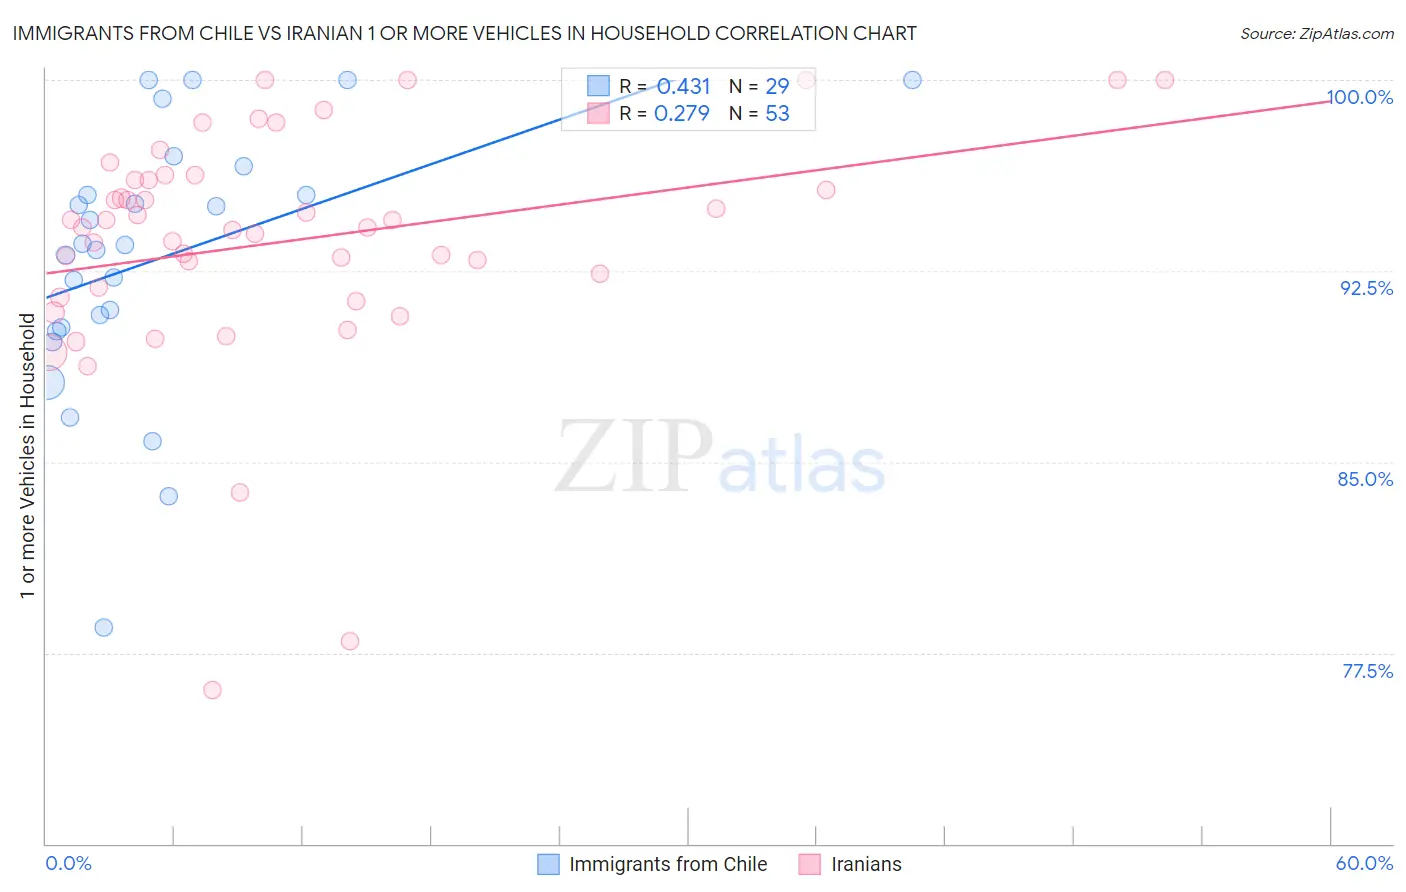
Immigrants from Chile vs Iranian 1 or more Vehicles in Household Correlation Chart
The statistical analysis conducted on geographies consisting of 218,611,230 people shows a moderate positive correlation between the proportion of Immigrants from Chile and percentage of households with 1 or more vehicles available in the United States with a correlation coefficient (R) of 0.431 and weighted average of 89.1%. Similarly, the statistical analysis conducted on geographies consisting of 316,682,996 people shows a weak positive correlation between the proportion of Iranians and percentage of households with 1 or more vehicles available in the United States with a correlation coefficient (R) of 0.279 and weighted average of 91.5%, a difference of 2.7%.
1 or more Vehicles in Household Correlation Summary
| Measurement | Immigrants from Chile | Iranian |
| Minimum | 78.5% | 76.0% |
| Maximum | 100.0% | 100.0% |
| Range | 21.5% | 24.0% |
| Mean | 93.0% | 93.6% |
| Median | 93.5% | 94.2% |
| Interquartile 25% (IQ1) | 90.2% | 91.6% |
| Interquartile 75% (IQ3) | 96.0% | 96.2% |
| Interquartile Range (IQR) | 5.9% | 4.5% |
| Standard Deviation (Sample) | 5.2% | 4.7% |
| Standard Deviation (Population) | 5.1% | 4.7% |
Similar Demographics by 1 or more Vehicles in Household
Demographics Similar to Immigrants from Chile by 1 or more Vehicles in Household
In terms of 1 or more vehicles in household, the demographic groups most similar to Immigrants from Chile are Immigrants from Denmark (89.1%, a difference of 0.010%), Immigrants from Italy (89.1%, a difference of 0.010%), Dutch West Indian (89.0%, a difference of 0.030%), Apache (89.1%, a difference of 0.050%), and Sierra Leonean (89.0%, a difference of 0.050%).
| Demographics | Rating | Rank | 1 or more Vehicles in Household |
| Immigrants | Western Europe | 20.5 /100 | #201 | Fair 89.2% |
| Iroquois | 19.8 /100 | #202 | Poor 89.2% |
| Cambodians | 18.9 /100 | #203 | Poor 89.2% |
| Romanians | 18.2 /100 | #204 | Poor 89.2% |
| Guatemalans | 17.8 /100 | #205 | Poor 89.2% |
| Apache | 16.2 /100 | #206 | Poor 89.1% |
| Immigrants | Denmark | 14.8 /100 | #207 | Poor 89.1% |
| Immigrants | Chile | 14.4 /100 | #208 | Poor 89.1% |
| Immigrants | Italy | 14.0 /100 | #209 | Poor 89.1% |
| Dutch West Indians | 13.5 /100 | #210 | Poor 89.0% |
| Sierra Leoneans | 13.0 /100 | #211 | Poor 89.0% |
| Somalis | 12.8 /100 | #212 | Poor 89.0% |
| Immigrants | Western Asia | 12.3 /100 | #213 | Poor 89.0% |
| Immigrants | Hungary | 11.9 /100 | #214 | Poor 89.0% |
| Immigrants | Sri Lanka | 10.2 /100 | #215 | Poor 88.9% |
Demographics Similar to Iranians by 1 or more Vehicles in Household
In terms of 1 or more vehicles in household, the demographic groups most similar to Iranians are Immigrants from Philippines (91.5%, a difference of 0.0%), Immigrants from South Central Asia (91.5%, a difference of 0.020%), Bolivian (91.5%, a difference of 0.020%), Cuban (91.5%, a difference of 0.040%), and Immigrants from South Eastern Asia (91.4%, a difference of 0.050%).
| Demographics | Rating | Rank | 1 or more Vehicles in Household |
| Poles | 99.7 /100 | #71 | Exceptional 91.7% |
| Cajuns | 99.7 /100 | #72 | Exceptional 91.7% |
| Immigrants | Iran | 99.7 /100 | #73 | Exceptional 91.7% |
| Immigrants | Lebanon | 99.6 /100 | #74 | Exceptional 91.6% |
| Portuguese | 99.5 /100 | #75 | Exceptional 91.6% |
| Cubans | 99.5 /100 | #76 | Exceptional 91.5% |
| Immigrants | Philippines | 99.4 /100 | #77 | Exceptional 91.5% |
| Iranians | 99.4 /100 | #78 | Exceptional 91.5% |
| Immigrants | South Central Asia | 99.4 /100 | #79 | Exceptional 91.5% |
| Bolivians | 99.4 /100 | #80 | Exceptional 91.5% |
| Immigrants | South Eastern Asia | 99.3 /100 | #81 | Exceptional 91.4% |
| Lebanese | 99.3 /100 | #82 | Exceptional 91.4% |
| Immigrants | England | 99.3 /100 | #83 | Exceptional 91.4% |
| Jordanians | 99.3 /100 | #84 | Exceptional 91.4% |
| Tsimshian | 99.3 /100 | #85 | Exceptional 91.4% |