Immigrants from Cabo Verde vs Peruvian 1 or more Vehicles in Household
COMPARE
Immigrants from Cabo Verde
Peruvian
1 or more Vehicles in Household
1 or more Vehicles in Household Comparison
Immigrants from Cabo Verde
Peruvians
81.6%
1 OR MORE VEHICLES IN HOUSEHOLD
0.0/ 100
METRIC RATING
322nd/ 347
METRIC RANK
88.8%
1 OR MORE VEHICLES IN HOUSEHOLD
7.9/ 100
METRIC RATING
221st/ 347
METRIC RANK
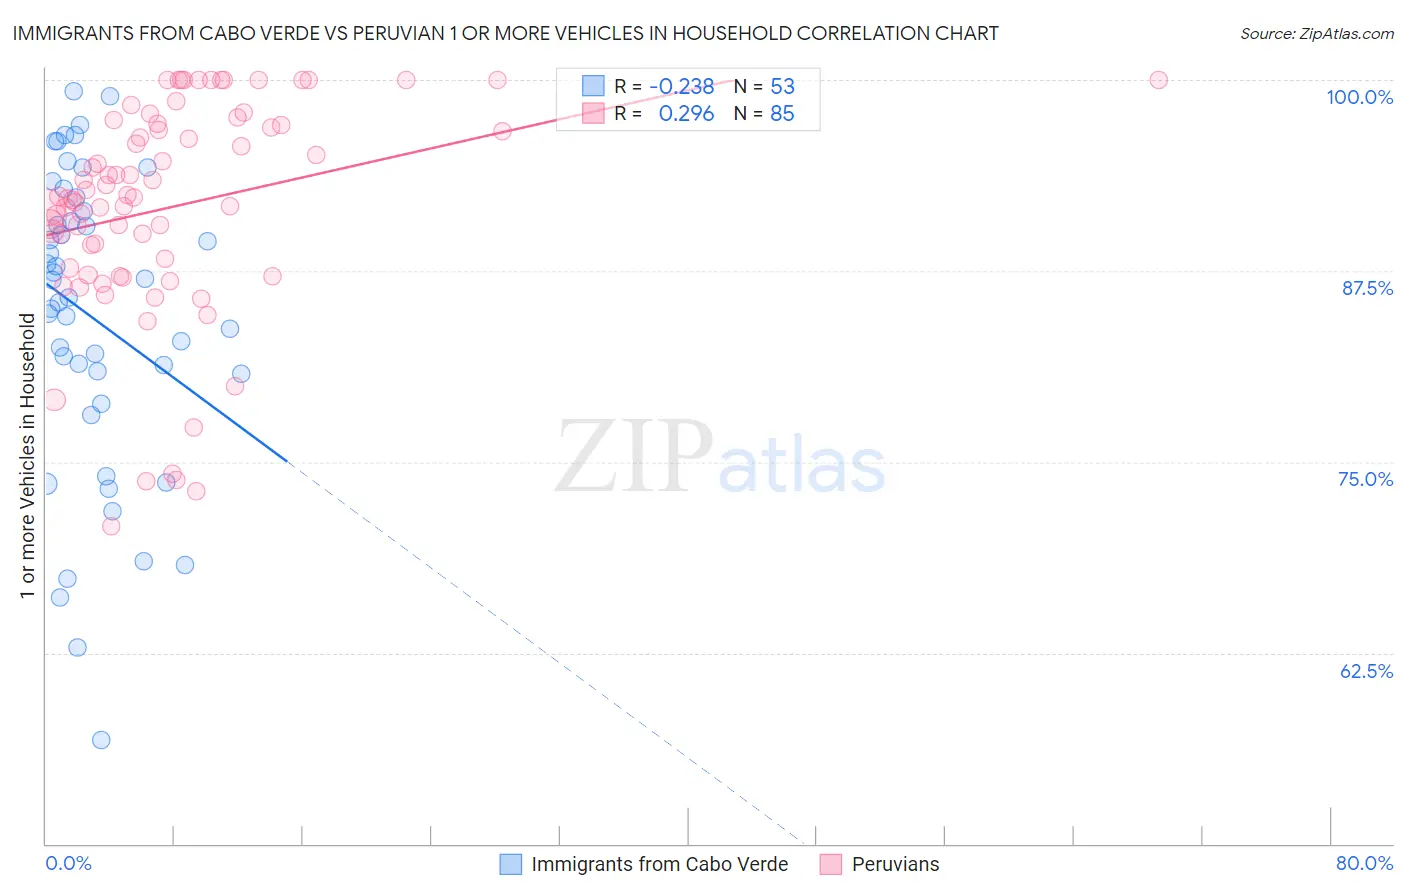
Immigrants from Cabo Verde vs Peruvian 1 or more Vehicles in Household Correlation Chart
The statistical analysis conducted on geographies consisting of 38,145,332 people shows a weak negative correlation between the proportion of Immigrants from Cabo Verde and percentage of households with 1 or more vehicles available in the United States with a correlation coefficient (R) of -0.238 and weighted average of 81.6%. Similarly, the statistical analysis conducted on geographies consisting of 363,028,617 people shows a weak positive correlation between the proportion of Peruvians and percentage of households with 1 or more vehicles available in the United States with a correlation coefficient (R) of 0.296 and weighted average of 88.8%, a difference of 8.9%.
1 or more Vehicles in Household Correlation Summary
| Measurement | Immigrants from Cabo Verde | Peruvian |
| Minimum | 56.8% | 70.8% |
| Maximum | 99.3% | 100.0% |
| Range | 42.5% | 29.2% |
| Mean | 84.4% | 91.7% |
| Median | 85.7% | 92.3% |
| Interquartile 25% (IQ1) | 79.8% | 87.5% |
| Interquartile 75% (IQ3) | 91.9% | 97.1% |
| Interquartile Range (IQR) | 12.1% | 9.6% |
| Standard Deviation (Sample) | 9.9% | 7.0% |
| Standard Deviation (Population) | 9.8% | 7.0% |
Similar Demographics by 1 or more Vehicles in Household
Demographics Similar to Immigrants from Cabo Verde by 1 or more Vehicles in Household
In terms of 1 or more vehicles in household, the demographic groups most similar to Immigrants from Cabo Verde are Jamaican (82.1%, a difference of 0.67%), Soviet Union (82.7%, a difference of 1.3%), Immigrants from Yemen (80.5%, a difference of 1.3%), Immigrants from Caribbean (80.4%, a difference of 1.4%), and Senegalese (80.4%, a difference of 1.5%).
| Demographics | Rating | Rank | 1 or more Vehicles in Household |
| Cypriots | 0.0 /100 | #315 | Tragic 84.4% |
| Alaska Natives | 0.0 /100 | #316 | Tragic 83.8% |
| Ghanaians | 0.0 /100 | #317 | Tragic 83.6% |
| Immigrants | Ghana | 0.0 /100 | #318 | Tragic 83.4% |
| Immigrants | Belarus | 0.0 /100 | #319 | Tragic 83.3% |
| Soviet Union | 0.0 /100 | #320 | Tragic 82.7% |
| Jamaicans | 0.0 /100 | #321 | Tragic 82.1% |
| Immigrants | Cabo Verde | 0.0 /100 | #322 | Tragic 81.6% |
| Immigrants | Yemen | 0.0 /100 | #323 | Tragic 80.5% |
| Immigrants | Caribbean | 0.0 /100 | #324 | Tragic 80.4% |
| Senegalese | 0.0 /100 | #325 | Tragic 80.4% |
| Immigrants | West Indies | 0.0 /100 | #326 | Tragic 79.5% |
| Immigrants | Senegal | 0.0 /100 | #327 | Tragic 79.0% |
| Ecuadorians | 0.0 /100 | #328 | Tragic 77.9% |
| Immigrants | Dominica | 0.0 /100 | #329 | Tragic 77.8% |
Demographics Similar to Peruvians by 1 or more Vehicles in Household
In terms of 1 or more vehicles in household, the demographic groups most similar to Peruvians are Immigrants from Zaire (88.8%, a difference of 0.010%), Ugandan (88.9%, a difference of 0.040%), Immigrants from Guatemala (88.9%, a difference of 0.040%), Argentinean (88.9%, a difference of 0.050%), and Uruguayan (88.8%, a difference of 0.050%).
| Demographics | Rating | Rank | 1 or more Vehicles in Household |
| Immigrants | Hungary | 11.9 /100 | #214 | Poor 89.0% |
| Immigrants | Sri Lanka | 10.2 /100 | #215 | Poor 88.9% |
| Immigrants | Argentina | 9.4 /100 | #216 | Tragic 88.9% |
| Argentineans | 8.8 /100 | #217 | Tragic 88.9% |
| Ugandans | 8.7 /100 | #218 | Tragic 88.9% |
| Immigrants | Guatemala | 8.6 /100 | #219 | Tragic 88.9% |
| Immigrants | Zaire | 8.1 /100 | #220 | Tragic 88.8% |
| Peruvians | 7.9 /100 | #221 | Tragic 88.8% |
| Uruguayans | 7.0 /100 | #222 | Tragic 88.8% |
| Immigrants | South America | 7.0 /100 | #223 | Tragic 88.8% |
| Immigrants | Hong Kong | 6.2 /100 | #224 | Tragic 88.7% |
| Cree | 6.0 /100 | #225 | Tragic 88.7% |
| Cheyenne | 5.7 /100 | #226 | Tragic 88.7% |
| Ute | 5.6 /100 | #227 | Tragic 88.7% |
| Immigrants | Norway | 5.5 /100 | #228 | Tragic 88.7% |