Immigrants from Cabo Verde vs Swedish 1 or more Vehicles in Household
COMPARE
Immigrants from Cabo Verde
Swedish
1 or more Vehicles in Household
1 or more Vehicles in Household Comparison
Immigrants from Cabo Verde
Swedes
81.6%
1 OR MORE VEHICLES IN HOUSEHOLD
0.0/ 100
METRIC RATING
322nd/ 347
METRIC RANK
93.3%
1 OR MORE VEHICLES IN HOUSEHOLD
100.0/ 100
METRIC RATING
8th/ 347
METRIC RANK
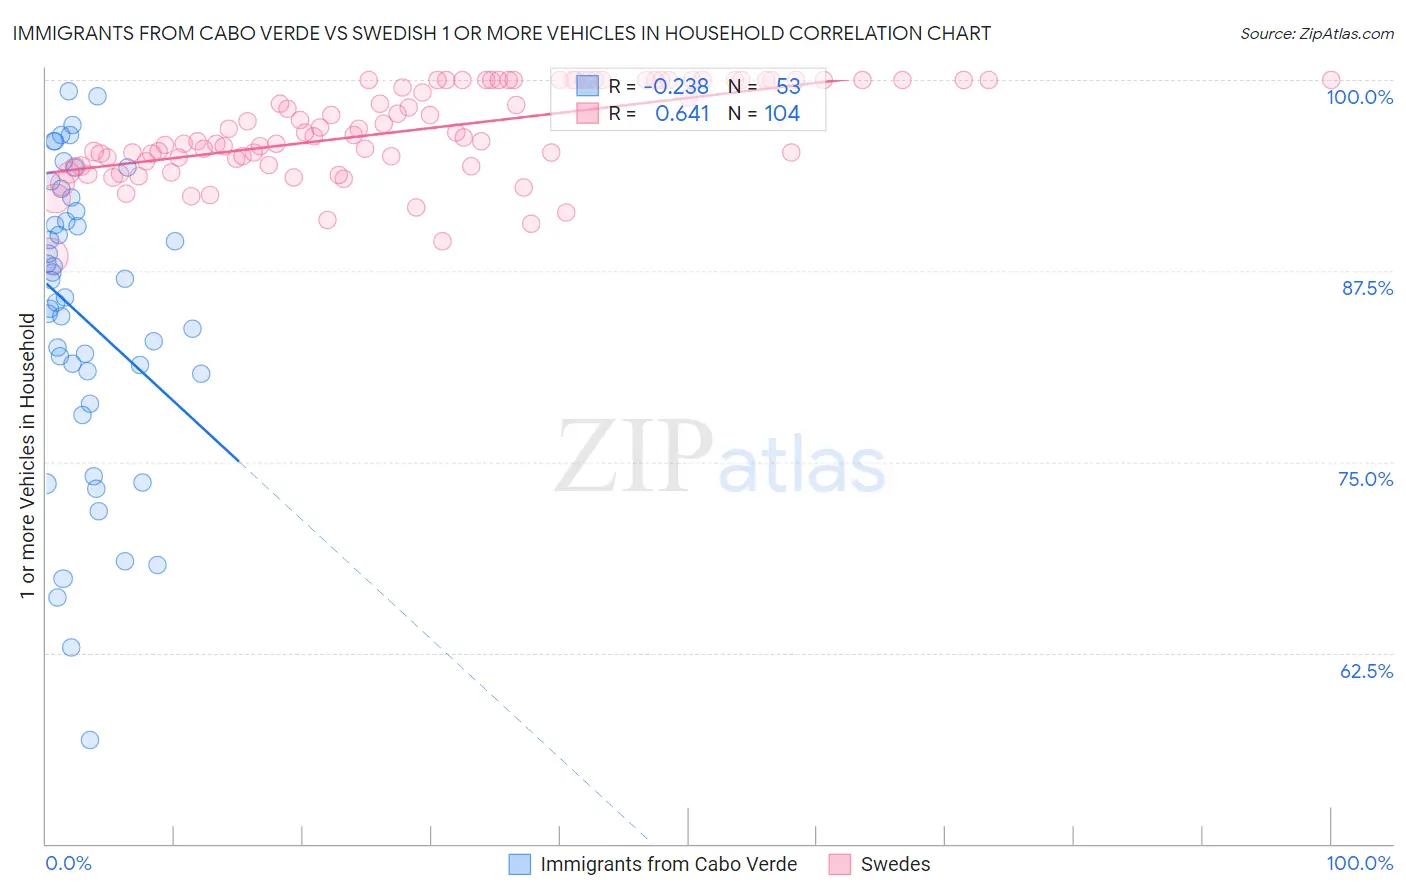
Immigrants from Cabo Verde vs Swedish 1 or more Vehicles in Household Correlation Chart
The statistical analysis conducted on geographies consisting of 38,145,332 people shows a weak negative correlation between the proportion of Immigrants from Cabo Verde and percentage of households with 1 or more vehicles available in the United States with a correlation coefficient (R) of -0.238 and weighted average of 81.6%. Similarly, the statistical analysis conducted on geographies consisting of 538,855,851 people shows a significant positive correlation between the proportion of Swedes and percentage of households with 1 or more vehicles available in the United States with a correlation coefficient (R) of 0.641 and weighted average of 93.3%, a difference of 14.4%.
1 or more Vehicles in Household Correlation Summary
| Measurement | Immigrants from Cabo Verde | Swedish |
| Minimum | 56.8% | 88.5% |
| Maximum | 99.3% | 100.0% |
| Range | 42.5% | 11.5% |
| Mean | 84.4% | 96.7% |
| Median | 85.7% | 96.5% |
| Interquartile 25% (IQ1) | 79.8% | 94.8% |
| Interquartile 75% (IQ3) | 91.9% | 100.0% |
| Interquartile Range (IQR) | 12.1% | 5.2% |
| Standard Deviation (Sample) | 9.9% | 2.9% |
| Standard Deviation (Population) | 9.8% | 2.9% |
Similar Demographics by 1 or more Vehicles in Household
Demographics Similar to Immigrants from Cabo Verde by 1 or more Vehicles in Household
In terms of 1 or more vehicles in household, the demographic groups most similar to Immigrants from Cabo Verde are Jamaican (82.1%, a difference of 0.67%), Soviet Union (82.7%, a difference of 1.3%), Immigrants from Yemen (80.5%, a difference of 1.3%), Immigrants from Caribbean (80.4%, a difference of 1.4%), and Senegalese (80.4%, a difference of 1.5%).
| Demographics | Rating | Rank | 1 or more Vehicles in Household |
| Cypriots | 0.0 /100 | #315 | Tragic 84.4% |
| Alaska Natives | 0.0 /100 | #316 | Tragic 83.8% |
| Ghanaians | 0.0 /100 | #317 | Tragic 83.6% |
| Immigrants | Ghana | 0.0 /100 | #318 | Tragic 83.4% |
| Immigrants | Belarus | 0.0 /100 | #319 | Tragic 83.3% |
| Soviet Union | 0.0 /100 | #320 | Tragic 82.7% |
| Jamaicans | 0.0 /100 | #321 | Tragic 82.1% |
| Immigrants | Cabo Verde | 0.0 /100 | #322 | Tragic 81.6% |
| Immigrants | Yemen | 0.0 /100 | #323 | Tragic 80.5% |
| Immigrants | Caribbean | 0.0 /100 | #324 | Tragic 80.4% |
| Senegalese | 0.0 /100 | #325 | Tragic 80.4% |
| Immigrants | West Indies | 0.0 /100 | #326 | Tragic 79.5% |
| Immigrants | Senegal | 0.0 /100 | #327 | Tragic 79.0% |
| Ecuadorians | 0.0 /100 | #328 | Tragic 77.9% |
| Immigrants | Dominica | 0.0 /100 | #329 | Tragic 77.8% |
Demographics Similar to Swedes by 1 or more Vehicles in Household
In terms of 1 or more vehicles in household, the demographic groups most similar to Swedes are Scotch-Irish (93.3%, a difference of 0.010%), Scottish (93.4%, a difference of 0.040%), Dutch (93.3%, a difference of 0.040%), Czech (93.3%, a difference of 0.070%), and Danish (93.5%, a difference of 0.23%).
| Demographics | Rating | Rank | 1 or more Vehicles in Household |
| Luxembourgers | 100.0 /100 | #1 | Exceptional 94.8% |
| English | 100.0 /100 | #2 | Exceptional 93.8% |
| Norwegians | 100.0 /100 | #3 | Exceptional 93.7% |
| Germans | 100.0 /100 | #4 | Exceptional 93.6% |
| Yakama | 100.0 /100 | #5 | Exceptional 93.6% |
| Danes | 100.0 /100 | #6 | Exceptional 93.5% |
| Scottish | 100.0 /100 | #7 | Exceptional 93.4% |
| Swedes | 100.0 /100 | #8 | Exceptional 93.3% |
| Scotch-Irish | 100.0 /100 | #9 | Exceptional 93.3% |
| Dutch | 100.0 /100 | #10 | Exceptional 93.3% |
| Czechs | 100.0 /100 | #11 | Exceptional 93.3% |
| Scandinavians | 100.0 /100 | #12 | Exceptional 93.1% |
| Whites/Caucasians | 100.0 /100 | #13 | Exceptional 93.1% |
| Irish | 100.0 /100 | #14 | Exceptional 93.1% |
| Mexicans | 100.0 /100 | #15 | Exceptional 93.0% |