Icelander vs Immigrants from Cambodia No Vehicles in Household
COMPARE
Icelander
Immigrants from Cambodia
No Vehicles in Household
No Vehicles in Household Comparison
Icelanders
Immigrants from Cambodia
9.6%
NO VEHICLES IN HOUSEHOLD
90.2/ 100
METRIC RATING
126th/ 347
METRIC RANK
10.2%
NO VEHICLES IN HOUSEHOLD
63.7/ 100
METRIC RATING
163rd/ 347
METRIC RANK
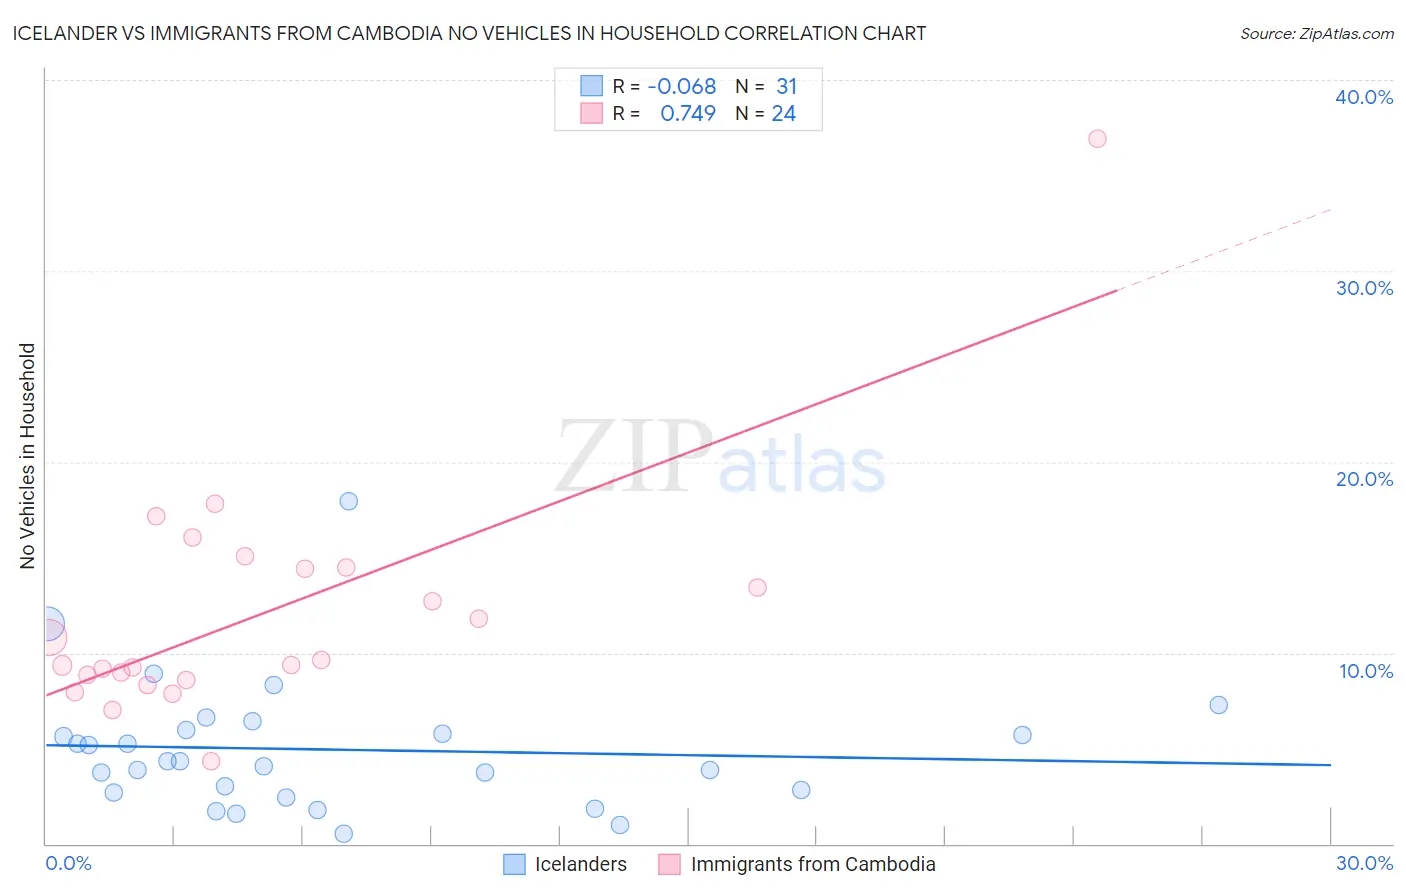
Icelander vs Immigrants from Cambodia No Vehicles in Household Correlation Chart
The statistical analysis conducted on geographies consisting of 159,468,771 people shows a slight negative correlation between the proportion of Icelanders and percentage of households with no vehicle available in the United States with a correlation coefficient (R) of -0.068 and weighted average of 9.6%. Similarly, the statistical analysis conducted on geographies consisting of 205,038,606 people shows a strong positive correlation between the proportion of Immigrants from Cambodia and percentage of households with no vehicle available in the United States with a correlation coefficient (R) of 0.749 and weighted average of 10.2%, a difference of 6.1%.
No Vehicles in Household Correlation Summary
| Measurement | Icelander | Immigrants from Cambodia |
| Minimum | 0.55% | 4.3% |
| Maximum | 17.9% | 36.9% |
| Range | 17.4% | 32.6% |
| Mean | 4.9% | 12.0% |
| Median | 4.3% | 9.5% |
| Interquartile 25% (IQ1) | 2.7% | 8.7% |
| Interquartile 75% (IQ3) | 6.0% | 14.4% |
| Interquartile Range (IQR) | 3.3% | 5.7% |
| Standard Deviation (Sample) | 3.4% | 6.3% |
| Standard Deviation (Population) | 3.4% | 6.2% |
Similar Demographics by No Vehicles in Household
Demographics Similar to Icelanders by No Vehicles in Household
In terms of no vehicles in household, the demographic groups most similar to Icelanders are Immigrants from Cameroon (9.6%, a difference of 0.17%), Immigrants from Kenya (9.6%, a difference of 0.18%), Immigrants from Syria (9.6%, a difference of 0.27%), Nicaraguan (9.7%, a difference of 0.29%), and Immigrants from Korea (9.6%, a difference of 0.30%).
| Demographics | Rating | Rank | No Vehicles in Household |
| Fijians | 92.7 /100 | #119 | Exceptional 9.5% |
| Immigrants | Thailand | 92.6 /100 | #120 | Exceptional 9.5% |
| Puget Sound Salish | 92.4 /100 | #121 | Exceptional 9.5% |
| Costa Ricans | 92.3 /100 | #122 | Exceptional 9.5% |
| Blackfeet | 91.4 /100 | #123 | Exceptional 9.6% |
| Immigrants | Korea | 90.9 /100 | #124 | Exceptional 9.6% |
| Immigrants | Cameroon | 90.6 /100 | #125 | Exceptional 9.6% |
| Icelanders | 90.2 /100 | #126 | Exceptional 9.6% |
| Immigrants | Kenya | 89.7 /100 | #127 | Excellent 9.6% |
| Immigrants | Syria | 89.5 /100 | #128 | Excellent 9.6% |
| Nicaraguans | 89.5 /100 | #129 | Excellent 9.7% |
| Burmese | 88.8 /100 | #130 | Excellent 9.7% |
| Immigrants | Azores | 88.2 /100 | #131 | Excellent 9.7% |
| Kenyans | 88.0 /100 | #132 | Excellent 9.7% |
| Immigrants | Oceania | 87.1 /100 | #133 | Excellent 9.7% |
Demographics Similar to Immigrants from Cambodia by No Vehicles in Household
In terms of no vehicles in household, the demographic groups most similar to Immigrants from Cambodia are Immigrants from Austria (10.2%, a difference of 0.11%), New Zealander (10.2%, a difference of 0.21%), Immigrants from Middle Africa (10.2%, a difference of 0.31%), South African (10.2%, a difference of 0.37%), and Comanche (10.2%, a difference of 0.42%).
| Demographics | Rating | Rank | No Vehicles in Household |
| Immigrants | Micronesia | 70.9 /100 | #156 | Good 10.1% |
| Australians | 70.6 /100 | #157 | Good 10.1% |
| Spanish American Indians | 70.2 /100 | #158 | Good 10.1% |
| Immigrants | Indonesia | 69.3 /100 | #159 | Good 10.1% |
| Immigrants | Middle Africa | 65.7 /100 | #160 | Good 10.2% |
| New Zealanders | 65.1 /100 | #161 | Good 10.2% |
| Immigrants | Austria | 64.4 /100 | #162 | Good 10.2% |
| Immigrants | Cambodia | 63.7 /100 | #163 | Good 10.2% |
| South Africans | 61.1 /100 | #164 | Good 10.2% |
| Comanche | 60.8 /100 | #165 | Good 10.2% |
| Immigrants | Costa Rica | 60.5 /100 | #166 | Good 10.3% |
| Immigrants | Saudi Arabia | 58.8 /100 | #167 | Average 10.3% |
| Indonesians | 56.7 /100 | #168 | Average 10.3% |
| Lumbee | 54.7 /100 | #169 | Average 10.3% |
| Immigrants | Latin America | 53.2 /100 | #170 | Average 10.4% |