European vs American No Vehicles in Household
COMPARE
European
American
No Vehicles in Household
No Vehicles in Household Comparison
Europeans
Americans
7.1%
NO VEHICLES IN HOUSEHOLD
100.0/ 100
METRIC RATING
16th/ 347
METRIC RANK
7.7%
NO VEHICLES IN HOUSEHOLD
100.0/ 100
METRIC RATING
29th/ 347
METRIC RANK
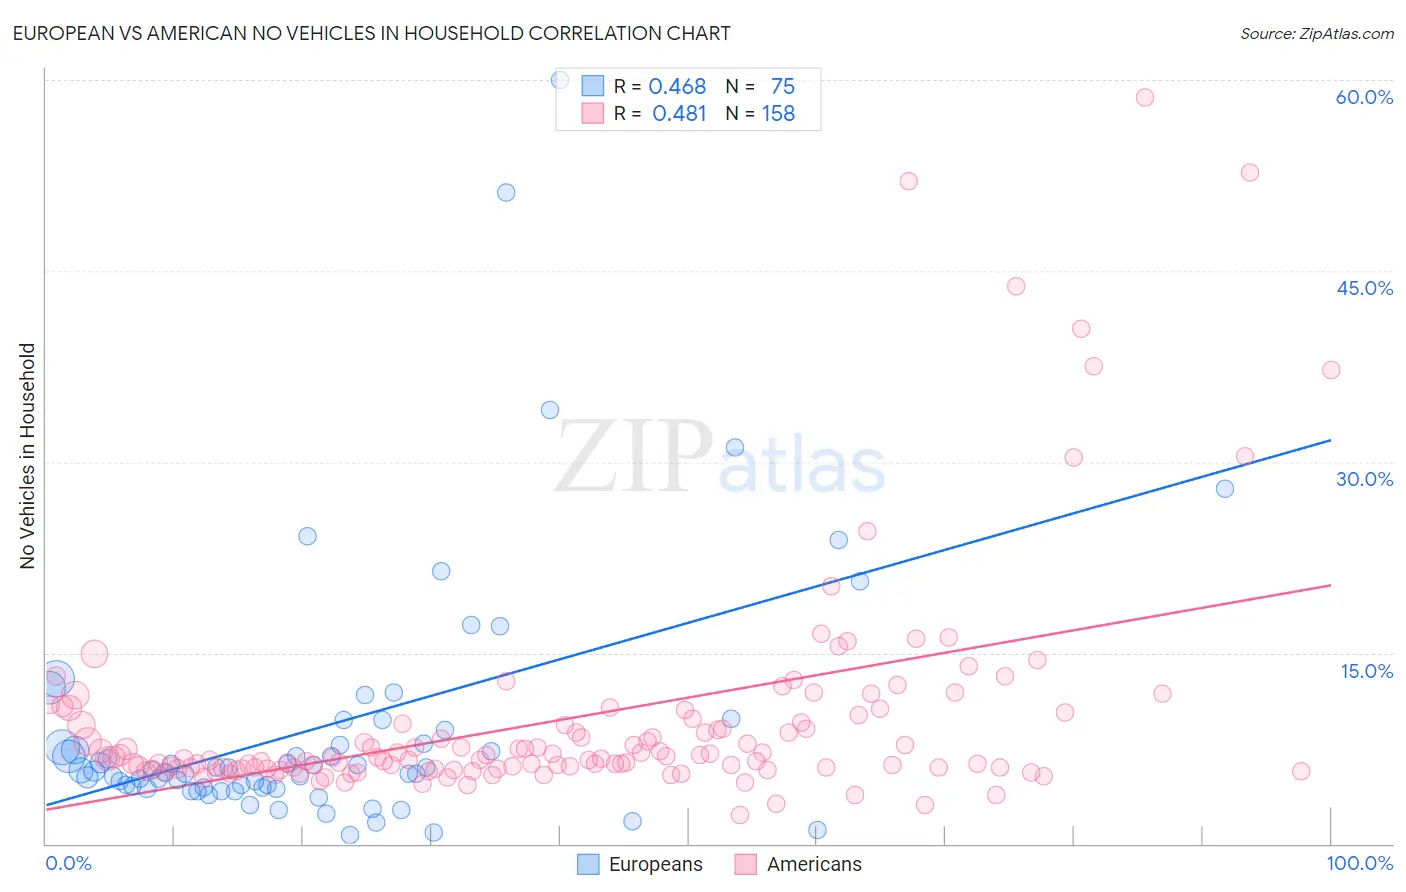
European vs American No Vehicles in Household Correlation Chart
The statistical analysis conducted on geographies consisting of 556,916,357 people shows a moderate positive correlation between the proportion of Europeans and percentage of households with no vehicle available in the United States with a correlation coefficient (R) of 0.468 and weighted average of 7.1%. Similarly, the statistical analysis conducted on geographies consisting of 575,304,149 people shows a moderate positive correlation between the proportion of Americans and percentage of households with no vehicle available in the United States with a correlation coefficient (R) of 0.481 and weighted average of 7.7%, a difference of 7.5%.
No Vehicles in Household Correlation Summary
| Measurement | European | American |
| Minimum | 0.69% | 2.2% |
| Maximum | 60.0% | 58.7% |
| Range | 59.3% | 56.4% |
| Mean | 9.2% | 9.8% |
| Median | 5.8% | 6.7% |
| Interquartile 25% (IQ1) | 4.4% | 5.9% |
| Interquartile 75% (IQ3) | 8.9% | 9.5% |
| Interquartile Range (IQR) | 4.5% | 3.6% |
| Standard Deviation (Sample) | 10.3% | 9.0% |
| Standard Deviation (Population) | 10.2% | 9.0% |
Demographics Similar to Europeans and Americans by No Vehicles in Household
In terms of no vehicles in household, the demographic groups most similar to Europeans are Welsh (7.2%, a difference of 0.56%), Tongan (7.2%, a difference of 0.78%), White/Caucasian (7.0%, a difference of 1.1%), Mexican (7.0%, a difference of 1.3%), and Scandinavian (7.0%, a difference of 1.5%). Similarly, the demographic groups most similar to Americans are Samoan (7.6%, a difference of 0.29%), Finnish (7.7%, a difference of 0.30%), Native Hawaiian (7.7%, a difference of 0.45%), Malaysian (7.7%, a difference of 0.70%), and British (7.6%, a difference of 0.84%).
| Demographics | Rating | Rank | No Vehicles in Household |
| Assyrians/Chaldeans/Syriacs | 100.0 /100 | #12 | Exceptional 7.0% |
| Scandinavians | 100.0 /100 | #13 | Exceptional 7.0% |
| Mexicans | 100.0 /100 | #14 | Exceptional 7.0% |
| Whites/Caucasians | 100.0 /100 | #15 | Exceptional 7.0% |
| Europeans | 100.0 /100 | #16 | Exceptional 7.1% |
| Welsh | 100.0 /100 | #17 | Exceptional 7.2% |
| Tongans | 100.0 /100 | #18 | Exceptional 7.2% |
| Arapaho | 100.0 /100 | #19 | Exceptional 7.4% |
| Ottawa | 100.0 /100 | #20 | Exceptional 7.4% |
| Nepalese | 100.0 /100 | #21 | Exceptional 7.4% |
| Irish | 100.0 /100 | #22 | Exceptional 7.4% |
| French | 100.0 /100 | #23 | Exceptional 7.4% |
| Immigrants | Iraq | 100.0 /100 | #24 | Exceptional 7.5% |
| Yaqui | 100.0 /100 | #25 | Exceptional 7.5% |
| Sri Lankans | 100.0 /100 | #26 | Exceptional 7.6% |
| British | 100.0 /100 | #27 | Exceptional 7.6% |
| Samoans | 100.0 /100 | #28 | Exceptional 7.6% |
| Americans | 100.0 /100 | #29 | Exceptional 7.7% |
| Finns | 100.0 /100 | #30 | Exceptional 7.7% |
| Native Hawaiians | 100.0 /100 | #31 | Exceptional 7.7% |
| Malaysians | 100.0 /100 | #32 | Exceptional 7.7% |