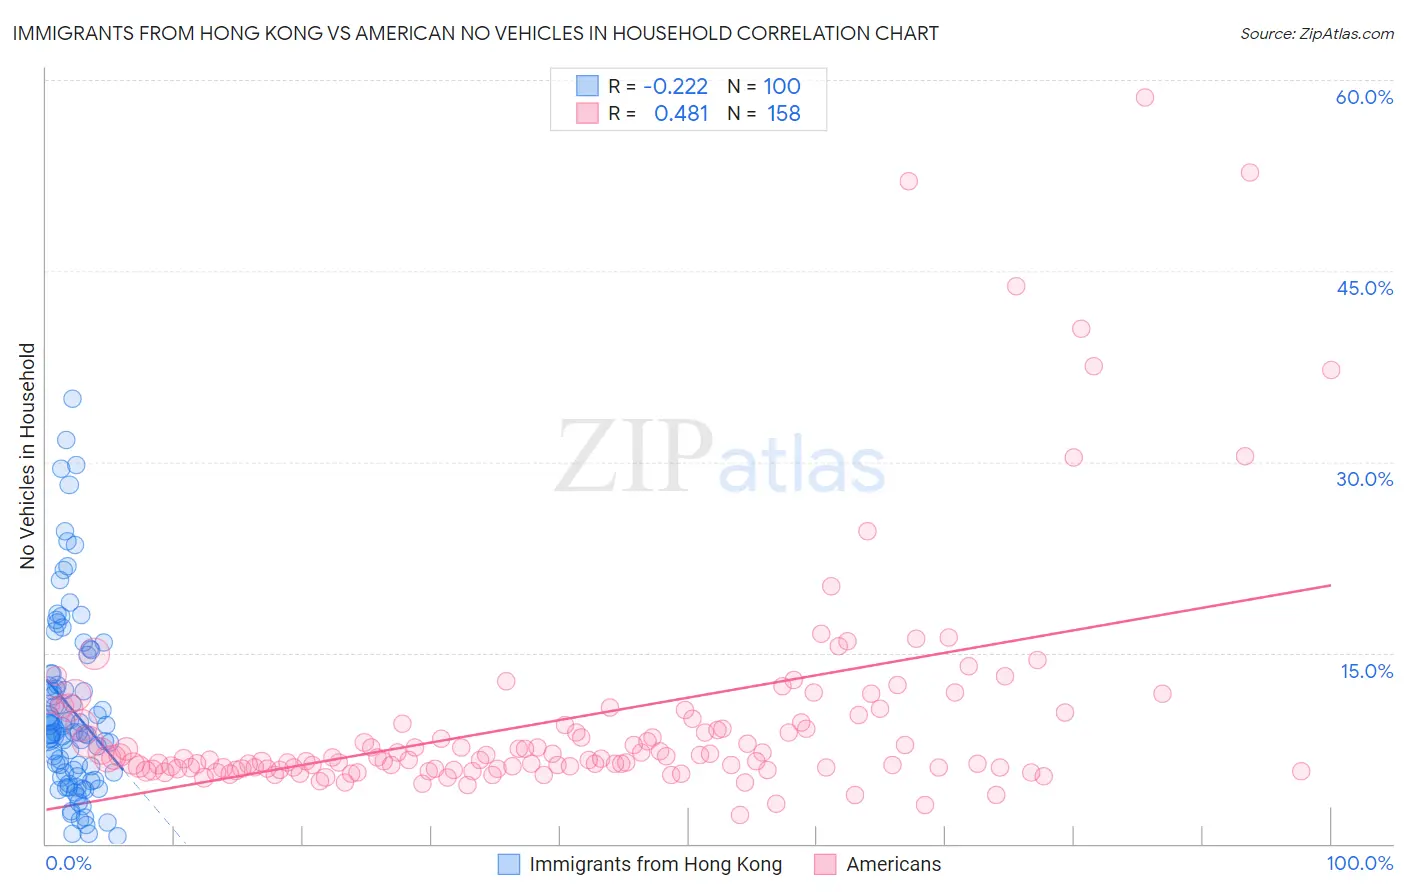
Immigrants from Hong Kong vs American No Vehicles in Household
COMPARE
Immigrants from Hong Kong
American
No Vehicles in Household
No Vehicles in Household Comparison
Immigrants from Hong Kong
Americans
11.3%
NO VEHICLES IN HOUSEHOLD
7.2/ 100
METRIC RATING
224th/ 347
METRIC RANK
7.7%
NO VEHICLES IN HOUSEHOLD
100.0/ 100
METRIC RATING
29th/ 347
METRIC RANK
Immigrants from Hong Kong vs American No Vehicles in Household Correlation Chart
The statistical analysis conducted on geographies consisting of 243,044,688 people shows a weak negative correlation between the proportion of Immigrants from Hong Kong and percentage of households with no vehicle available in the United States with a correlation coefficient (R) of -0.222 and weighted average of 11.3%. Similarly, the statistical analysis conducted on geographies consisting of 575,304,149 people shows a moderate positive correlation between the proportion of Americans and percentage of households with no vehicle available in the United States with a correlation coefficient (R) of 0.481 and weighted average of 7.7%, a difference of 47.7%.
No Vehicles in Household Correlation Summary
| Measurement | Immigrants from Hong Kong | American |
| Minimum | 0.63% | 2.2% |
| Maximum | 35.0% | 58.7% |
| Range | 34.4% | 56.4% |
| Mean | 10.6% | 9.8% |
| Median | 8.7% | 6.7% |
| Interquartile 25% (IQ1) | 5.5% | 5.9% |
| Interquartile 75% (IQ3) | 13.3% | 9.5% |
| Interquartile Range (IQR) | 7.9% | 3.6% |
| Standard Deviation (Sample) | 7.2% | 9.0% |
| Standard Deviation (Population) | 7.2% | 9.0% |
Similar Demographics by No Vehicles in Household
Demographics Similar to Immigrants from Hong Kong by No Vehicles in Household
In terms of no vehicles in household, the demographic groups most similar to Immigrants from Hong Kong are Uruguayan (11.3%, a difference of 0.22%), Immigrants from Sierra Leone (11.3%, a difference of 0.37%), Immigrants from South America (11.3%, a difference of 0.38%), Peruvian (11.2%, a difference of 0.52%), and Immigrants from Somalia (11.4%, a difference of 0.93%).
| Demographics | Rating | Rank | No Vehicles in Household |
| Dutch West Indians | 10.2 /100 | #217 | Poor 11.2% |
| Immigrants | Guatemala | 10.0 /100 | #218 | Tragic 11.2% |
| Argentineans | 9.6 /100 | #219 | Tragic 11.2% |
| Immigrants | Zaire | 9.6 /100 | #220 | Tragic 11.2% |
| Peruvians | 8.4 /100 | #221 | Tragic 11.2% |
| Immigrants | South America | 8.0 /100 | #222 | Tragic 11.3% |
| Uruguayans | 7.7 /100 | #223 | Tragic 11.3% |
| Immigrants | Hong Kong | 7.2 /100 | #224 | Tragic 11.3% |
| Immigrants | Sierra Leone | 6.4 /100 | #225 | Tragic 11.3% |
| Immigrants | Somalia | 5.4 /100 | #226 | Tragic 11.4% |
| Immigrants | Pakistan | 5.4 /100 | #227 | Tragic 11.4% |
| Immigrants | Romania | 5.3 /100 | #228 | Tragic 11.4% |
| Ugandans | 5.3 /100 | #229 | Tragic 11.4% |
| Immigrants | Norway | 5.1 /100 | #230 | Tragic 11.4% |
| Immigrants | Japan | 5.1 /100 | #231 | Tragic 11.4% |
Demographics Similar to Americans by No Vehicles in Household
In terms of no vehicles in household, the demographic groups most similar to Americans are Samoan (7.6%, a difference of 0.29%), Finnish (7.7%, a difference of 0.30%), Native Hawaiian (7.7%, a difference of 0.45%), Malaysian (7.7%, a difference of 0.70%), and Immigrants from Taiwan (7.7%, a difference of 0.81%).
| Demographics | Rating | Rank | No Vehicles in Household |
| Irish | 100.0 /100 | #22 | Exceptional 7.4% |
| French | 100.0 /100 | #23 | Exceptional 7.4% |
| Immigrants | Iraq | 100.0 /100 | #24 | Exceptional 7.5% |
| Yaqui | 100.0 /100 | #25 | Exceptional 7.5% |
| Sri Lankans | 100.0 /100 | #26 | Exceptional 7.6% |
| British | 100.0 /100 | #27 | Exceptional 7.6% |
| Samoans | 100.0 /100 | #28 | Exceptional 7.6% |
| Americans | 100.0 /100 | #29 | Exceptional 7.7% |
| Finns | 100.0 /100 | #30 | Exceptional 7.7% |
| Native Hawaiians | 100.0 /100 | #31 | Exceptional 7.7% |
| Malaysians | 100.0 /100 | #32 | Exceptional 7.7% |
| Immigrants | Taiwan | 100.0 /100 | #33 | Exceptional 7.7% |
| Immigrants | Vietnam | 100.0 /100 | #34 | Exceptional 7.7% |
| Cherokee | 99.9 /100 | #35 | Exceptional 7.7% |
| Iraqis | 99.9 /100 | #36 | Exceptional 7.7% |