South American vs Canadian No Vehicles in Household
COMPARE
South American
Canadian
No Vehicles in Household
No Vehicles in Household Comparison
South Americans
Canadians
10.5%
NO VEHICLES IN HOUSEHOLD
41.9/ 100
METRIC RATING
185th/ 347
METRIC RANK
8.3%
NO VEHICLES IN HOUSEHOLD
99.7/ 100
METRIC RATING
65th/ 347
METRIC RANK
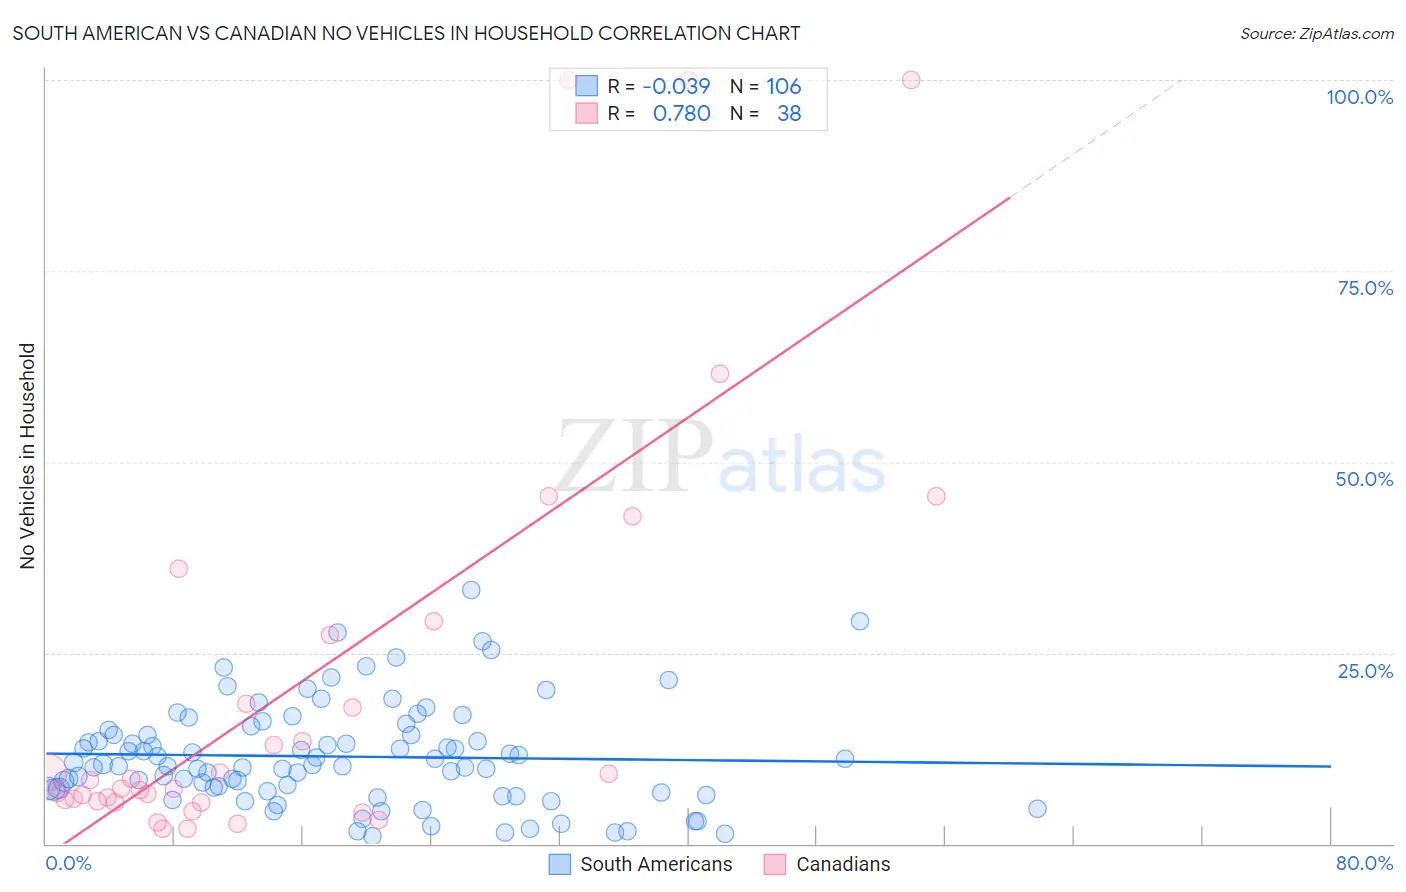
South American vs Canadian No Vehicles in Household Correlation Chart
The statistical analysis conducted on geographies consisting of 480,536,487 people shows no correlation between the proportion of South Americans and percentage of households with no vehicle available in the United States with a correlation coefficient (R) of -0.039 and weighted average of 10.5%. Similarly, the statistical analysis conducted on geographies consisting of 435,931,333 people shows a strong positive correlation between the proportion of Canadians and percentage of households with no vehicle available in the United States with a correlation coefficient (R) of 0.780 and weighted average of 8.3%, a difference of 26.4%.
No Vehicles in Household Correlation Summary
| Measurement | South American | Canadian |
| Minimum | 1.0% | 1.9% |
| Maximum | 33.2% | 100.0% |
| Range | 32.2% | 98.1% |
| Mean | 11.4% | 20.8% |
| Median | 10.3% | 7.8% |
| Interquartile 25% (IQ1) | 7.1% | 5.6% |
| Interquartile 75% (IQ3) | 14.2% | 27.3% |
| Interquartile Range (IQR) | 7.1% | 21.7% |
| Standard Deviation (Sample) | 6.6% | 27.6% |
| Standard Deviation (Population) | 6.6% | 27.2% |
Similar Demographics by No Vehicles in Household
Demographics Similar to South Americans by No Vehicles in Household
In terms of no vehicles in household, the demographic groups most similar to South Americans are Immigrants from Nepal (10.5%, a difference of 0.070%), German Russian (10.5%, a difference of 0.18%), Native/Alaskan (10.5%, a difference of 0.24%), Immigrants from Bulgaria (10.5%, a difference of 0.26%), and Immigrants from Colombia (10.5%, a difference of 0.30%).
| Demographics | Rating | Rank | No Vehicles in Household |
| Immigrants | Ethiopia | 48.0 /100 | #178 | Average 10.4% |
| Ethiopians | 45.8 /100 | #179 | Average 10.5% |
| Arabs | 45.3 /100 | #180 | Average 10.5% |
| Immigrants | Colombia | 44.1 /100 | #181 | Average 10.5% |
| Immigrants | Bulgaria | 43.8 /100 | #182 | Average 10.5% |
| Natives/Alaskans | 43.7 /100 | #183 | Average 10.5% |
| Immigrants | Nepal | 42.4 /100 | #184 | Average 10.5% |
| South Americans | 41.9 /100 | #185 | Average 10.5% |
| German Russians | 40.6 /100 | #186 | Average 10.5% |
| Immigrants | Poland | 38.4 /100 | #187 | Fair 10.6% |
| Immigrants | Armenia | 37.5 /100 | #188 | Fair 10.6% |
| Immigrants | Eritrea | 36.3 /100 | #189 | Fair 10.6% |
| Immigrants | North Macedonia | 34.6 /100 | #190 | Fair 10.6% |
| Immigrants | Northern Europe | 33.1 /100 | #191 | Fair 10.7% |
| Carpatho Rusyns | 32.1 /100 | #192 | Fair 10.7% |
Demographics Similar to Canadians by No Vehicles in Household
In terms of no vehicles in household, the demographic groups most similar to Canadians are Palestinian (8.3%, a difference of 0.11%), Immigrants from Scotland (8.3%, a difference of 0.12%), Immigrants from Iran (8.4%, a difference of 0.52%), Spaniard (8.4%, a difference of 0.57%), and Croatian (8.3%, a difference of 0.75%).
| Demographics | Rating | Rank | No Vehicles in Household |
| Immigrants | Mexico | 99.8 /100 | #58 | Exceptional 8.1% |
| Immigrants | India | 99.8 /100 | #59 | Exceptional 8.2% |
| Immigrants | Laos | 99.8 /100 | #60 | Exceptional 8.2% |
| Thais | 99.8 /100 | #61 | Exceptional 8.2% |
| Chinese | 99.8 /100 | #62 | Exceptional 8.2% |
| Slovaks | 99.8 /100 | #63 | Exceptional 8.3% |
| Croatians | 99.8 /100 | #64 | Exceptional 8.3% |
| Canadians | 99.7 /100 | #65 | Exceptional 8.3% |
| Palestinians | 99.7 /100 | #66 | Exceptional 8.3% |
| Immigrants | Scotland | 99.7 /100 | #67 | Exceptional 8.3% |
| Immigrants | Iran | 99.7 /100 | #68 | Exceptional 8.4% |
| Spaniards | 99.7 /100 | #69 | Exceptional 8.4% |
| Cajuns | 99.6 /100 | #70 | Exceptional 8.4% |
| Immigrants | Lebanon | 99.6 /100 | #71 | Exceptional 8.4% |
| Lithuanians | 99.6 /100 | #72 | Exceptional 8.4% |