Alaskan Athabascan vs Immigrants from Bosnia and Herzegovina No Vehicles in Household
COMPARE
Alaskan Athabascan
Immigrants from Bosnia and Herzegovina
No Vehicles in Household
No Vehicles in Household Comparison
Alaskan Athabascans
Immigrants from Bosnia and Herzegovina
15.6%
NO VEHICLES IN HOUSEHOLD
0.0/ 100
METRIC RATING
312th/ 347
METRIC RANK
9.9%
NO VEHICLES IN HOUSEHOLD
79.1/ 100
METRIC RATING
148th/ 347
METRIC RANK
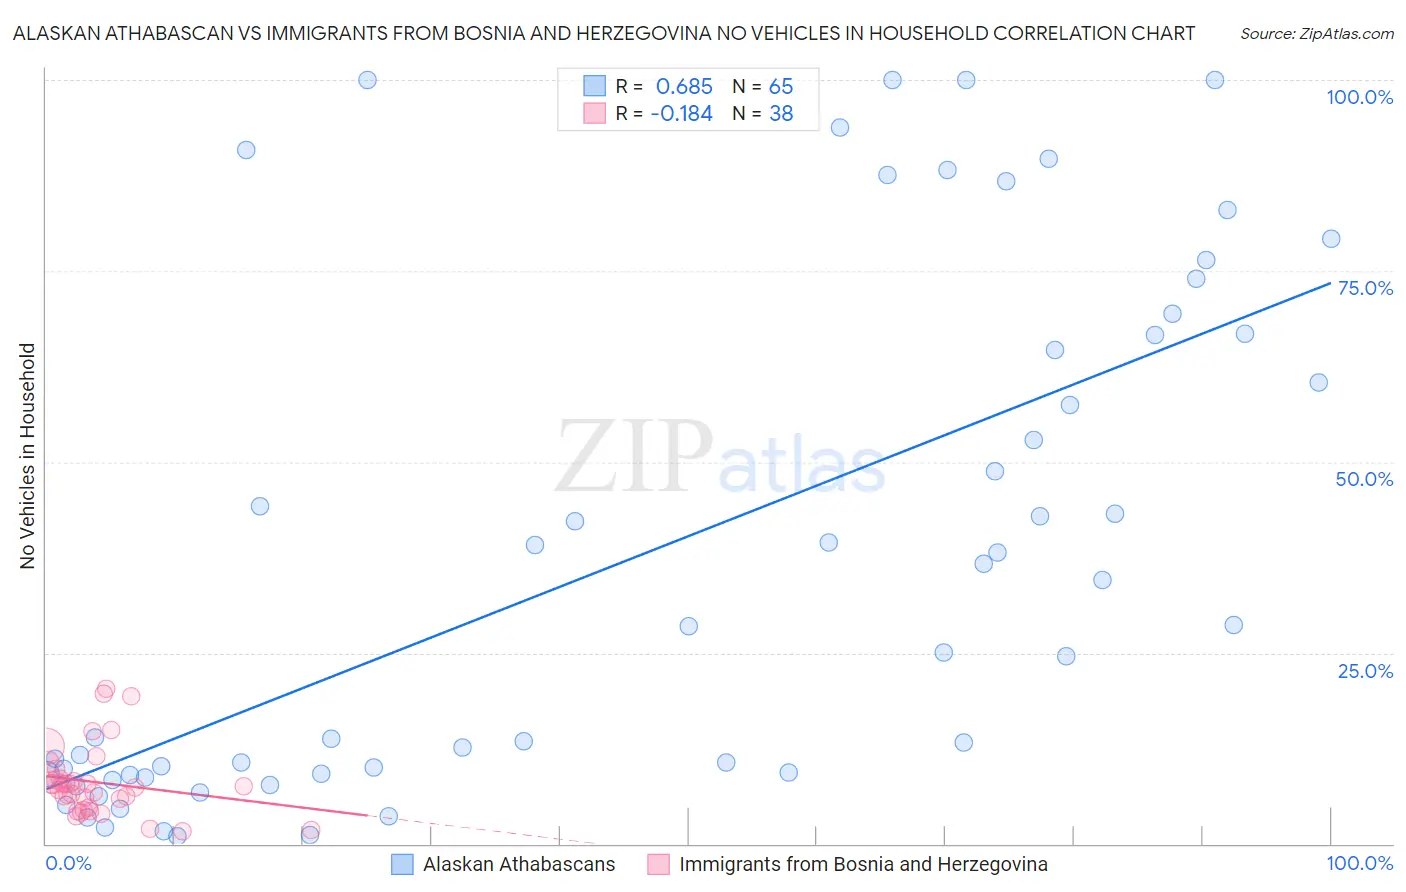
Alaskan Athabascan vs Immigrants from Bosnia and Herzegovina No Vehicles in Household Correlation Chart
The statistical analysis conducted on geographies consisting of 45,793,877 people shows a significant positive correlation between the proportion of Alaskan Athabascans and percentage of households with no vehicle available in the United States with a correlation coefficient (R) of 0.685 and weighted average of 15.6%. Similarly, the statistical analysis conducted on geographies consisting of 156,763,936 people shows a poor negative correlation between the proportion of Immigrants from Bosnia and Herzegovina and percentage of households with no vehicle available in the United States with a correlation coefficient (R) of -0.184 and weighted average of 9.9%, a difference of 57.0%.
No Vehicles in Household Correlation Summary
| Measurement | Alaskan Athabascan | Immigrants from Bosnia and Herzegovina |
| Minimum | 1.0% | 1.6% |
| Maximum | 100.0% | 20.3% |
| Range | 99.0% | 18.7% |
| Mean | 37.7% | 8.0% |
| Median | 28.5% | 7.4% |
| Interquartile 25% (IQ1) | 9.1% | 4.7% |
| Interquartile 75% (IQ3) | 66.7% | 8.5% |
| Interquartile Range (IQR) | 57.6% | 3.8% |
| Standard Deviation (Sample) | 33.1% | 4.6% |
| Standard Deviation (Population) | 32.8% | 4.6% |
Similar Demographics by No Vehicles in Household
Demographics Similar to Alaskan Athabascans by No Vehicles in Household
In terms of no vehicles in household, the demographic groups most similar to Alaskan Athabascans are Immigrants from Israel (15.6%, a difference of 0.15%), Tohono O'odham (15.6%, a difference of 0.15%), Cape Verdean (15.6%, a difference of 0.16%), Albanian (15.6%, a difference of 0.31%), and Cypriot (15.7%, a difference of 0.44%).
| Demographics | Rating | Rank | No Vehicles in Household |
| Immigrants | China | 0.0 /100 | #305 | Tragic 15.2% |
| Immigrants | Belize | 0.0 /100 | #306 | Tragic 15.4% |
| Immigrants | Haiti | 0.0 /100 | #307 | Tragic 15.4% |
| U.S. Virgin Islanders | 0.0 /100 | #308 | Tragic 15.4% |
| Puerto Ricans | 0.0 /100 | #309 | Tragic 15.5% |
| Cape Verdeans | 0.0 /100 | #310 | Tragic 15.6% |
| Immigrants | Israel | 0.0 /100 | #311 | Tragic 15.6% |
| Alaskan Athabascans | 0.0 /100 | #312 | Tragic 15.6% |
| Tohono O'odham | 0.0 /100 | #313 | Tragic 15.6% |
| Albanians | 0.0 /100 | #314 | Tragic 15.6% |
| Cypriots | 0.0 /100 | #315 | Tragic 15.7% |
| Ghanaians | 0.0 /100 | #316 | Tragic 16.4% |
| Immigrants | Ghana | 0.0 /100 | #317 | Tragic 16.6% |
| Immigrants | Belarus | 0.0 /100 | #318 | Tragic 16.7% |
| Alaska Natives | 0.0 /100 | #319 | Tragic 17.4% |
Demographics Similar to Immigrants from Bosnia and Herzegovina by No Vehicles in Household
In terms of no vehicles in household, the demographic groups most similar to Immigrants from Bosnia and Herzegovina are Immigrants from Nicaragua (9.9%, a difference of 0.15%), Hungarian (9.9%, a difference of 0.20%), Bahamian (9.9%, a difference of 0.43%), Chilean (9.9%, a difference of 0.46%), and Immigrants from Bahamas (9.9%, a difference of 0.46%).
| Demographics | Rating | Rank | No Vehicles in Household |
| Sudanese | 83.1 /100 | #141 | Excellent 9.8% |
| Immigrants | Zimbabwe | 82.6 /100 | #142 | Excellent 9.9% |
| Chileans | 81.2 /100 | #143 | Excellent 9.9% |
| Immigrants | Bahamas | 81.2 /100 | #144 | Excellent 9.9% |
| Bahamians | 81.0 /100 | #145 | Excellent 9.9% |
| Hungarians | 80.0 /100 | #146 | Excellent 9.9% |
| Immigrants | Nicaragua | 79.8 /100 | #147 | Good 9.9% |
| Immigrants | Bosnia and Herzegovina | 79.1 /100 | #148 | Good 9.9% |
| Immigrants | Uganda | 76.1 /100 | #149 | Good 10.0% |
| Colombians | 73.9 /100 | #150 | Good 10.0% |
| Immigrants | Eastern Africa | 73.8 /100 | #151 | Good 10.0% |
| Immigrants | Congo | 73.0 /100 | #152 | Good 10.1% |
| Tlingit-Haida | 72.5 /100 | #153 | Good 10.1% |
| Sioux | 72.4 /100 | #154 | Good 10.1% |
| Salvadorans | 72.4 /100 | #155 | Good 10.1% |