Zip Codes with the Highest Percentage of Private Company Employees in Cedar City, UT
RELATED REPORTS & OPTIONS
Private Company Employees
Cedar City
Compare Zip Codes
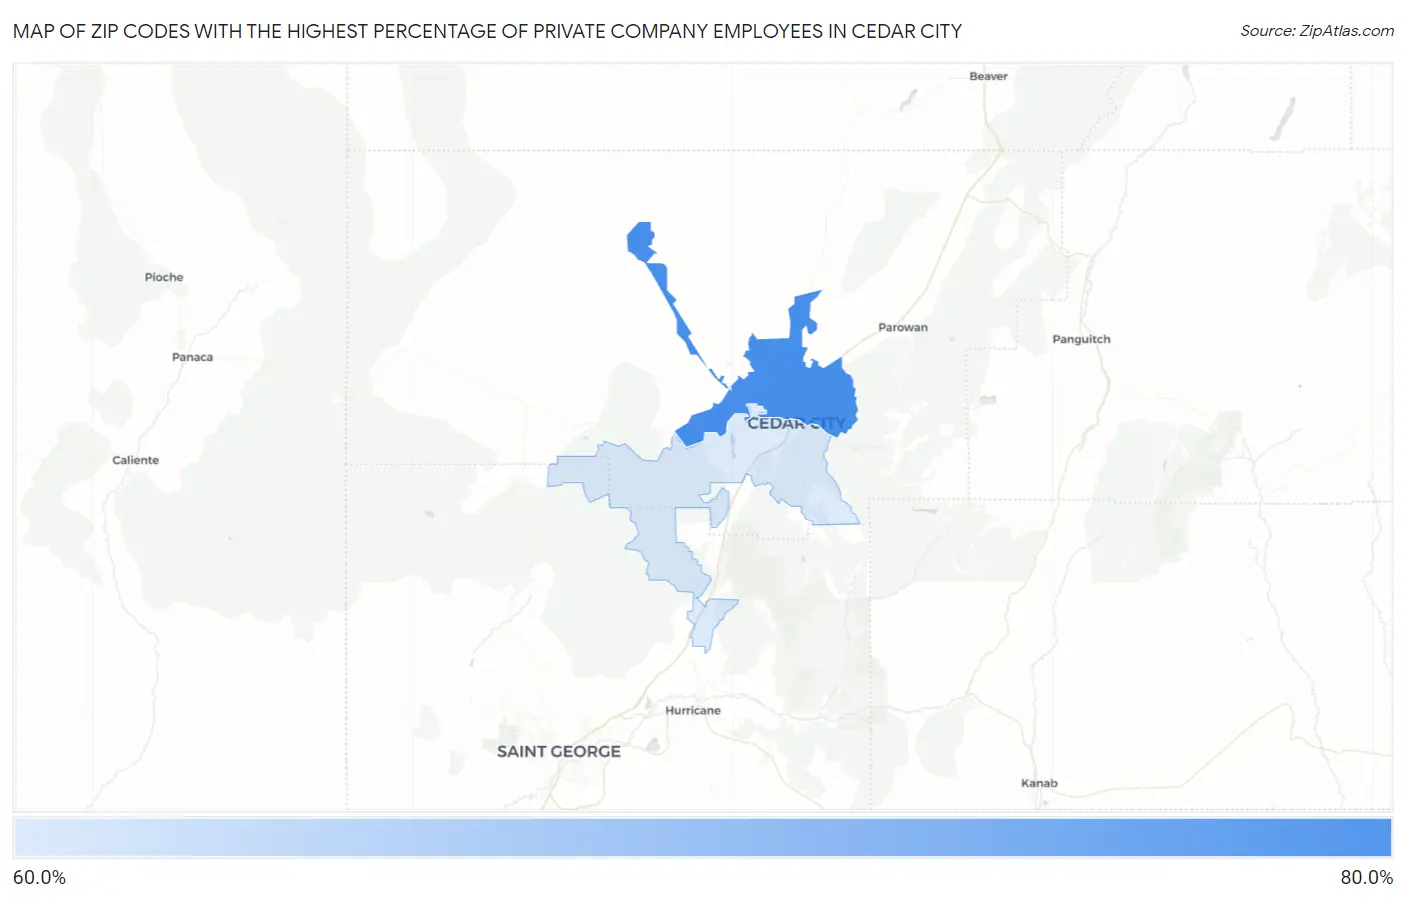
Map of Zip Codes with the Highest Percentage of Private Company Employees in Cedar City
61.9%
62.0%
Zip Codes with the Highest Percentage of Private Company Employees in Cedar City, UT
| Zip Code | % Private Company Employees | vs State | vs National | |
| 1. | 84721 | 62.0% | 68.4%(-6.46)#184 | 66.9%(-4.92)#20,463 |
| 2. | 84720 | 61.9% | 68.4%(-6.56)#186 | 66.9%(-5.02)#20,563 |
1
Common Questions
What are the Top Zip Codes with the Highest Percentage of Private Company Employees in Cedar City, UT?
Top Zip Codes with the Highest Percentage of Private Company Employees in Cedar City, UT are:
What zip code has the Highest Percentage of Private Company Employees in Cedar City, UT?
84721 has the Highest Percentage of Private Company Employees in Cedar City, UT with 62.0%.
What is the Percentage of Private Company Employees in Cedar City, UT?
Percentage of Private Company Employees in Cedar City is 65.2%.
What is the Percentage of Private Company Employees in Utah?
Percentage of Private Company Employees in Utah is 68.4%.
What is the Percentage of Private Company Employees in the United States?
Percentage of Private Company Employees in the United States is 66.9%.