Zimbabwean vs Immigrants from Trinidad and Tobago Unemployment Among Seniors over 75 years
COMPARE
Zimbabwean
Immigrants from Trinidad and Tobago
Unemployment Among Seniors over 75 years
Unemployment Among Seniors over 75 years Comparison
Zimbabweans
Immigrants from Trinidad and Tobago
8.7%
UNEMPLOYMENT AMONG SENIORS OVER 75 YEARS
54.1/ 100
METRIC RATING
170th/ 347
METRIC RANK
8.5%
UNEMPLOYMENT AMONG SENIORS OVER 75 YEARS
90.8/ 100
METRIC RATING
136th/ 347
METRIC RANK
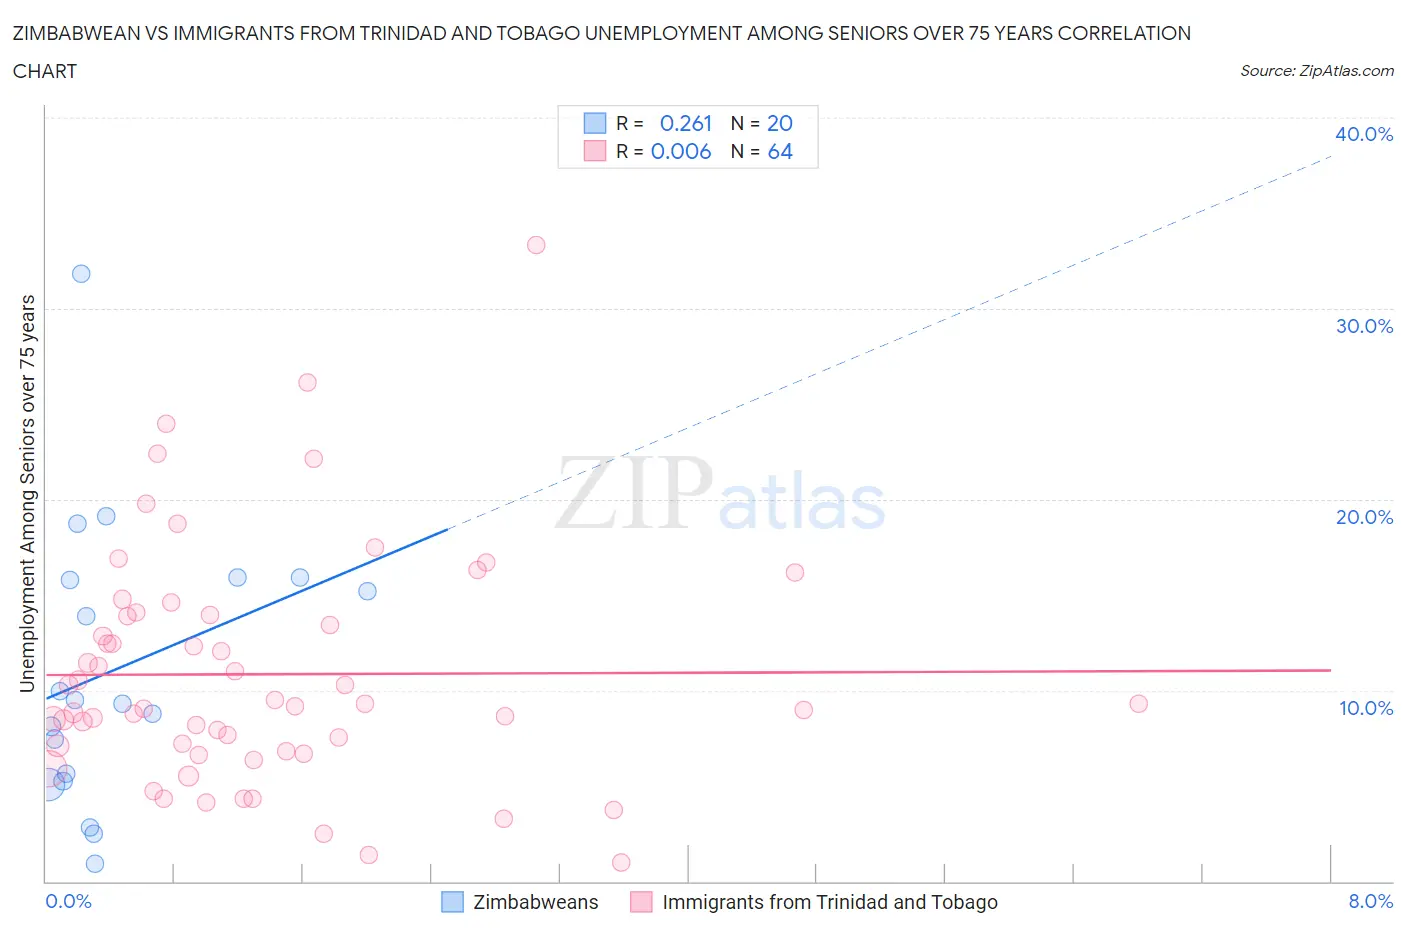
Zimbabwean vs Immigrants from Trinidad and Tobago Unemployment Among Seniors over 75 years Correlation Chart
The statistical analysis conducted on geographies consisting of 56,538,105 people shows a weak positive correlation between the proportion of Zimbabweans and unemployment rate among seniors over the age of 75 in the United States with a correlation coefficient (R) of 0.261 and weighted average of 8.7%. Similarly, the statistical analysis conducted on geographies consisting of 139,199,309 people shows no correlation between the proportion of Immigrants from Trinidad and Tobago and unemployment rate among seniors over the age of 75 in the United States with a correlation coefficient (R) of 0.006 and weighted average of 8.5%, a difference of 2.9%.
Unemployment Among Seniors over 75 years Correlation Summary
| Measurement | Zimbabwean | Immigrants from Trinidad and Tobago |
| Minimum | 0.90% | 1.0% |
| Maximum | 31.8% | 33.3% |
| Range | 30.9% | 32.3% |
| Mean | 11.1% | 10.8% |
| Median | 9.4% | 9.2% |
| Interquartile 25% (IQ1) | 5.4% | 7.0% |
| Interquartile 75% (IQ3) | 15.8% | 13.9% |
| Interquartile Range (IQR) | 10.4% | 7.0% |
| Standard Deviation (Sample) | 7.4% | 6.1% |
| Standard Deviation (Population) | 7.2% | 6.1% |
Similar Demographics by Unemployment Among Seniors over 75 years
Demographics Similar to Zimbabweans by Unemployment Among Seniors over 75 years
In terms of unemployment among seniors over 75 years, the demographic groups most similar to Zimbabweans are Dominican (8.7%, a difference of 0.12%), Immigrants (8.7%, a difference of 0.12%), Fijian (8.7%, a difference of 0.13%), Immigrants from Lithuania (8.7%, a difference of 0.17%), and Immigrants from Belize (8.7%, a difference of 0.19%).
| Demographics | Rating | Rank | Unemployment Among Seniors over 75 years |
| Immigrants | Guatemala | 68.4 /100 | #163 | Good 8.7% |
| Paraguayans | 62.2 /100 | #164 | Good 8.7% |
| Immigrants | Dominican Republic | 61.4 /100 | #165 | Good 8.7% |
| Immigrants | Belize | 57.6 /100 | #166 | Average 8.7% |
| Immigrants | Eastern Africa | 57.6 /100 | #167 | Average 8.7% |
| Immigrants | Lithuania | 57.2 /100 | #168 | Average 8.7% |
| Fijians | 56.4 /100 | #169 | Average 8.7% |
| Zimbabweans | 54.1 /100 | #170 | Average 8.7% |
| Dominicans | 51.9 /100 | #171 | Average 8.7% |
| Immigrants | Immigrants | 51.8 /100 | #172 | Average 8.7% |
| Australians | 50.3 /100 | #173 | Average 8.7% |
| Immigrants | El Salvador | 49.7 /100 | #174 | Average 8.7% |
| Syrians | 49.6 /100 | #175 | Average 8.7% |
| Somalis | 45.3 /100 | #176 | Average 8.8% |
| Central Americans | 43.3 /100 | #177 | Average 8.8% |
Demographics Similar to Immigrants from Trinidad and Tobago by Unemployment Among Seniors over 75 years
In terms of unemployment among seniors over 75 years, the demographic groups most similar to Immigrants from Trinidad and Tobago are Immigrants from Kuwait (8.5%, a difference of 0.040%), Haitian (8.5%, a difference of 0.11%), Immigrants from Bulgaria (8.5%, a difference of 0.18%), Barbadian (8.5%, a difference of 0.32%), and South American (8.5%, a difference of 0.42%).
| Demographics | Rating | Rank | Unemployment Among Seniors over 75 years |
| Ghanaians | 96.0 /100 | #129 | Exceptional 8.4% |
| Apache | 95.2 /100 | #130 | Exceptional 8.4% |
| German Russians | 94.9 /100 | #131 | Exceptional 8.4% |
| Chileans | 93.8 /100 | #132 | Exceptional 8.4% |
| Serbians | 93.7 /100 | #133 | Exceptional 8.4% |
| Immigrants | Czechoslovakia | 93.4 /100 | #134 | Exceptional 8.4% |
| Haitians | 91.4 /100 | #135 | Exceptional 8.5% |
| Immigrants | Trinidad and Tobago | 90.8 /100 | #136 | Exceptional 8.5% |
| Immigrants | Kuwait | 90.5 /100 | #137 | Exceptional 8.5% |
| Immigrants | Bulgaria | 89.6 /100 | #138 | Excellent 8.5% |
| Barbadians | 88.6 /100 | #139 | Excellent 8.5% |
| South Americans | 87.9 /100 | #140 | Excellent 8.5% |
| Immigrants | Bolivia | 87.9 /100 | #141 | Excellent 8.5% |
| Immigrants | Ukraine | 87.0 /100 | #142 | Excellent 8.5% |
| Immigrants | Costa Rica | 86.8 /100 | #143 | Excellent 8.5% |