Immigrants from Bahamas vs Immigrants from Trinidad and Tobago Unemployment Among Seniors over 75 years
COMPARE
Immigrants from Bahamas
Immigrants from Trinidad and Tobago
Unemployment Among Seniors over 75 years
Unemployment Among Seniors over 75 years Comparison
Immigrants from Bahamas
Immigrants from Trinidad and Tobago
8.6%
UNEMPLOYMENT AMONG SENIORS OVER 75 YEARS
76.5/ 100
METRIC RATING
156th/ 347
METRIC RANK
8.5%
UNEMPLOYMENT AMONG SENIORS OVER 75 YEARS
90.8/ 100
METRIC RATING
136th/ 347
METRIC RANK
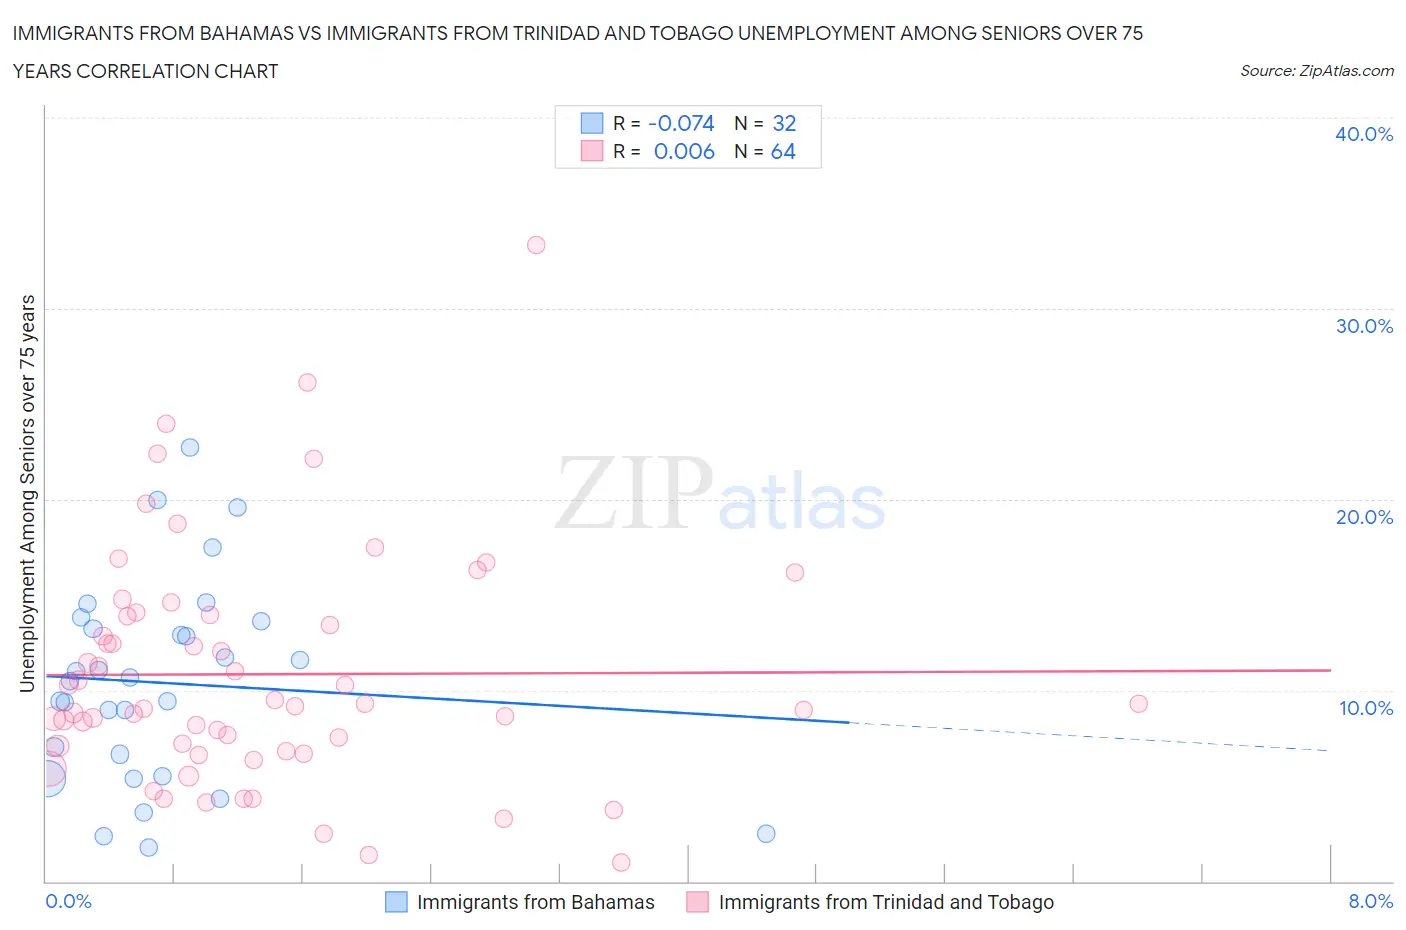
Immigrants from Bahamas vs Immigrants from Trinidad and Tobago Unemployment Among Seniors over 75 years Correlation Chart
The statistical analysis conducted on geographies consisting of 77,798,406 people shows a slight negative correlation between the proportion of Immigrants from Bahamas and unemployment rate among seniors over the age of 75 in the United States with a correlation coefficient (R) of -0.074 and weighted average of 8.6%. Similarly, the statistical analysis conducted on geographies consisting of 139,199,309 people shows no correlation between the proportion of Immigrants from Trinidad and Tobago and unemployment rate among seniors over the age of 75 in the United States with a correlation coefficient (R) of 0.006 and weighted average of 8.5%, a difference of 1.5%.
Unemployment Among Seniors over 75 years Correlation Summary
| Measurement | Immigrants from Bahamas | Immigrants from Trinidad and Tobago |
| Minimum | 1.8% | 1.0% |
| Maximum | 22.7% | 33.3% |
| Range | 20.9% | 32.3% |
| Mean | 10.4% | 10.8% |
| Median | 10.6% | 9.2% |
| Interquartile 25% (IQ1) | 6.1% | 7.0% |
| Interquartile 75% (IQ3) | 13.4% | 13.9% |
| Interquartile Range (IQR) | 7.3% | 7.0% |
| Standard Deviation (Sample) | 5.2% | 6.1% |
| Standard Deviation (Population) | 5.2% | 6.1% |
Demographics Similar to Immigrants from Bahamas and Immigrants from Trinidad and Tobago by Unemployment Among Seniors over 75 years
In terms of unemployment among seniors over 75 years, the demographic groups most similar to Immigrants from Bahamas are Ecuadorian (8.6%, a difference of 0.16%), Immigrants from Pakistan (8.6%, a difference of 0.26%), Mongolian (8.6%, a difference of 0.29%), Latvian (8.6%, a difference of 0.33%), and Immigrants from Bosnia and Herzegovina (8.6%, a difference of 0.34%). Similarly, the demographic groups most similar to Immigrants from Trinidad and Tobago are Immigrants from Kuwait (8.5%, a difference of 0.040%), Immigrants from Bulgaria (8.5%, a difference of 0.18%), Barbadian (8.5%, a difference of 0.32%), South American (8.5%, a difference of 0.42%), and Immigrants from Bolivia (8.5%, a difference of 0.42%).
| Demographics | Rating | Rank | Unemployment Among Seniors over 75 years |
| Immigrants | Trinidad and Tobago | 90.8 /100 | #136 | Exceptional 8.5% |
| Immigrants | Kuwait | 90.5 /100 | #137 | Exceptional 8.5% |
| Immigrants | Bulgaria | 89.6 /100 | #138 | Excellent 8.5% |
| Barbadians | 88.6 /100 | #139 | Excellent 8.5% |
| South Americans | 87.9 /100 | #140 | Excellent 8.5% |
| Immigrants | Bolivia | 87.9 /100 | #141 | Excellent 8.5% |
| Immigrants | Ukraine | 87.0 /100 | #142 | Excellent 8.5% |
| Immigrants | Costa Rica | 86.8 /100 | #143 | Excellent 8.5% |
| Colombians | 86.7 /100 | #144 | Excellent 8.5% |
| Immigrants | Romania | 86.2 /100 | #145 | Excellent 8.5% |
| Immigrants | South Eastern Asia | 85.8 /100 | #146 | Excellent 8.5% |
| Immigrants | Sierra Leone | 85.6 /100 | #147 | Excellent 8.5% |
| Immigrants | Colombia | 85.6 /100 | #148 | Excellent 8.5% |
| Immigrants | Ecuador | 84.6 /100 | #149 | Excellent 8.5% |
| Paiute | 82.5 /100 | #150 | Excellent 8.6% |
| Immigrants | Bosnia and Herzegovina | 80.6 /100 | #151 | Excellent 8.6% |
| Latvians | 80.5 /100 | #152 | Excellent 8.6% |
| Mongolians | 80.1 /100 | #153 | Excellent 8.6% |
| Immigrants | Pakistan | 79.7 /100 | #154 | Good 8.6% |
| Ecuadorians | 78.5 /100 | #155 | Good 8.6% |
| Immigrants | Bahamas | 76.5 /100 | #156 | Good 8.6% |