Yup'ik vs Immigrants Unemployment Among Women with Children Under 6 years

COMPARE

Yup'ik
Race
Ancestry
AfghanAfricanAlaska NativeAlaskan AthabascanAlbanianAleutAlsatianAmericanApacheArabArapahoArgentineanArmenianAssyrian/Chaldean/SyriacAustralianAustrianBahamianBangladeshiBarbadianBasqueBelgianBelizeanBermudanBhutaneseBlackfeetBolivianBrazilianBritishBritish West IndianBulgarianBurmeseCajunCambodianCanadianCape VerdeanCarpatho RusynCelticCentral AmericanCentral American IndianCherokeeCheyenneChickasawChileanChineseChippewaChoctawColombianColvilleComancheCosta RicanCreeCreekCroatianCrowCubanCypriotCzechCzechoslovakianDanishDelawareDominicanDutchDutch West IndianEastern EuropeanEcuadorianEgyptianEnglishEstonianEthiopianEuropeanFijianFilipinoFinnishFrenchFrench American IndianFrench CanadianGermanGerman RussianGhanaianGreekGuamanian/ChamorroGuatemalanGuyaneseHaitianHmongHonduranHopiHoumaHungarianIcelanderIndian (Asian)IndonesianInupiatIranianIraqiIrishIroquoisIsraeliItalianJamaicanJapaneseJordanianKenyanKiowaKoreanLaotianLatvianLebaneseLiberianLithuanianLumbeeLuxembourgerMacedonianMalaysianMalteseMarshalleseMenomineeMexicanMexican American IndianMongolianMoroccanNative HawaiianNavajoNepaleseNew ZealanderNicaraguanNigerianNorthern EuropeanNorwegianOkinawanOsageOttawaPaiutePakistaniPalestinianPanamanianParaguayanPennsylvania GermanPeruvianPimaPolishPortuguesePotawatomiPuebloPuerto RicanPuget Sound SalishRomanianRussianSalvadoranSamoanScandinavianScotch-IrishScottishSeminoleSenegaleseSerbianShoshoneSierra LeoneanSiouxSlavicSlovakSloveneSomaliSouth AfricanSouth AmericanSouth American IndianSoviet UnionSpaniardSpanishSpanish AmericanSpanish American IndianSri LankanSubsaharan AfricanSudaneseSwedishSwissSyrianTaiwaneseThaiTlingit-HaidaTohono O'OdhamTonganTrinidadian and TobagonianTsimshianTurkishU.S. Virgin IslanderUgandanUkrainianUruguayanUteVenezuelanVietnameseWelshWest IndianYakamaYaquiYugoslavianYumanYup'ikZimbabwean
Immigration
NonimmigrantsAfghanistanAfricaAlbaniaArgentinaArmeniaAsiaAustraliaAustriaBahamasBangladeshBarbadosBelarusBelgiumBelizeBoliviaBosnia and HerzegovinaBrazilBulgariaBurma/MyanmarCabo VerdeCambodiaCameroonCanadaCaribbeanCentral AmericaChileChinaColombiaCongoCosta RicaCroatiaCubaCzechoslovakiaDenmarkDominicaDominican RepublicEastern AfricaEastern AsiaEastern EuropeEcuadorEgyptEl SalvadorEnglandEritreaEthiopiaEuropeFijiFranceGermanyGhanaGreeceGrenadaGuatemalaGuyanaHaitiHondurasHong KongHungaryIndiaIndonesiaIranIraqIrelandIsraelItalyJamaicaJapanJordanKazakhstanKenyaKoreaKuwaitLaosLatin AmericaLatviaLebanonLiberiaLithuaniaMalaysiaMexicoMicronesiaMiddle AfricaMoldovaMoroccoNepalNetherlandsNicaraguaNigeriaNorth AmericaNorth MacedoniaNorthern AfricaNorthern EuropeNorwayOceaniaPakistanPanamaPeruPhilippinesPolandPortugalRomaniaRussiaSaudi ArabiaScotlandSenegalSerbiaSierra LeoneSingaporeSomaliaSouth AfricaSouth AmericaSouth Central AsiaSouth Eastern AsiaSouthern EuropeSpainSri LankaSt. Vincent and the GrenadinesSudanSwedenSwitzerlandSyriaTaiwanThailandTrinidad and TobagoTurkeyUgandaUkraineUruguayUzbekistanVenezuelaVietnamWest IndiesWestern AfricaWestern AsiaWestern EuropeYemenZaireZimbabweAzores
Immigrants
Race
Ancestry
AfghanAfricanAlaska NativeAlaskan AthabascanAlbanianAleutAlsatianAmericanApacheArabArapahoArgentineanArmenianAssyrian/Chaldean/SyriacAustralianAustrianBahamianBangladeshiBarbadianBasqueBelgianBelizeanBermudanBhutaneseBlackfeetBolivianBrazilianBritishBritish West IndianBulgarianBurmeseCajunCambodianCanadianCape VerdeanCarpatho RusynCelticCentral AmericanCentral American IndianCherokeeCheyenneChickasawChileanChineseChippewaChoctawColombianColvilleComancheCosta RicanCreeCreekCroatianCrowCubanCypriotCzechCzechoslovakianDanishDelawareDominicanDutchDutch West IndianEastern EuropeanEcuadorianEgyptianEnglishEstonianEthiopianEuropeanFijianFilipinoFinnishFrenchFrench American IndianFrench CanadianGermanGerman RussianGhanaianGreekGuamanian/ChamorroGuatemalanGuyaneseHaitianHmongHonduranHopiHoumaHungarianIcelanderIndian (Asian)IndonesianInupiatIranianIraqiIrishIroquoisIsraeliItalianJamaicanJapaneseJordanianKenyanKiowaKoreanLaotianLatvianLebaneseLiberianLithuanianLumbeeLuxembourgerMacedonianMalaysianMalteseMarshalleseMenomineeMexicanMexican American IndianMongolianMoroccanNative HawaiianNavajoNepaleseNew ZealanderNicaraguanNigerianNorthern EuropeanNorwegianOkinawanOsageOttawaPaiutePakistaniPalestinianPanamanianParaguayanPennsylvania GermanPeruvianPimaPolishPortuguesePotawatomiPuebloPuerto RicanPuget Sound SalishRomanianRussianSalvadoranSamoanScandinavianScotch-IrishScottishSeminoleSenegaleseSerbianShoshoneSierra LeoneanSiouxSlavicSlovakSloveneSomaliSouth AfricanSouth AmericanSouth American IndianSoviet UnionSpaniardSpanishSpanish AmericanSpanish American IndianSri LankanSubsaharan AfricanSudaneseSwedishSwissSyrianTaiwaneseThaiTlingit-HaidaTohono O'OdhamTonganTrinidadian and TobagonianTsimshianTurkishU.S. Virgin IslanderUgandanUkrainianUruguayanUteVenezuelanVietnameseWelshWest IndianYakamaYaquiYugoslavianYumanZimbabwean
Immigration
NonimmigrantsImmigrantsAfghanistanAfricaAlbaniaArgentinaArmeniaAsiaAustraliaAustriaBahamasBangladeshBarbadosBelarusBelgiumBelizeBoliviaBosnia and HerzegovinaBrazilBulgariaBurma/MyanmarCabo VerdeCambodiaCameroonCanadaCaribbeanCentral AmericaChileChinaColombiaCongoCosta RicaCroatiaCubaCzechoslovakiaDenmarkDominicaDominican RepublicEastern AfricaEastern AsiaEastern EuropeEcuadorEgyptEl SalvadorEnglandEritreaEthiopiaEuropeFijiFranceGermanyGhanaGreeceGrenadaGuatemalaGuyanaHaitiHondurasHong KongHungaryIndiaIndonesiaIranIraqIrelandIsraelItalyJamaicaJapanJordanKazakhstanKenyaKoreaKuwaitLaosLatin AmericaLatviaLebanonLiberiaLithuaniaMalaysiaMexicoMicronesiaMiddle AfricaMoldovaMoroccoNepalNetherlandsNicaraguaNigeriaNorth AmericaNorth MacedoniaNorthern AfricaNorthern EuropeNorwayOceaniaPakistanPanamaPeruPhilippinesPolandPortugalRomaniaRussiaSaudi ArabiaScotlandSenegalSerbiaSierra LeoneSingaporeSomaliaSouth AfricaSouth AmericaSouth Central AsiaSouth Eastern AsiaSouthern EuropeSpainSri LankaSt. Vincent and the GrenadinesSudanSwedenSwitzerlandSyriaTaiwanThailandTrinidad and TobagoTurkeyUgandaUkraineUruguayUzbekistanVenezuelaVietnamWest IndiesWestern AfricaWestern AsiaWestern EuropeYemenZaireZimbabweAzores
Unemployment Among Women with Children Under 6 years
Income
Poverty
Unemployment
Labor Participation
Family Structure
Vehicle Availability
Education Level
Disability

Unemployment Among Women with Children Under 6 years Comparison

Yup'ik

Immigrants

Tragic
Fair
21.1%
UNEMPLOYMENT AMONG WOMEN WITH CHILDREN UNDER 6 YEARS
0.0/ 100
METRIC RATING
347th/ 347
METRIC RANK
7.8%
UNEMPLOYMENT AMONG WOMEN WITH CHILDREN UNDER 6 YEARS
21.4/ 100
METRIC RATING
205th/ 347
METRIC RANK

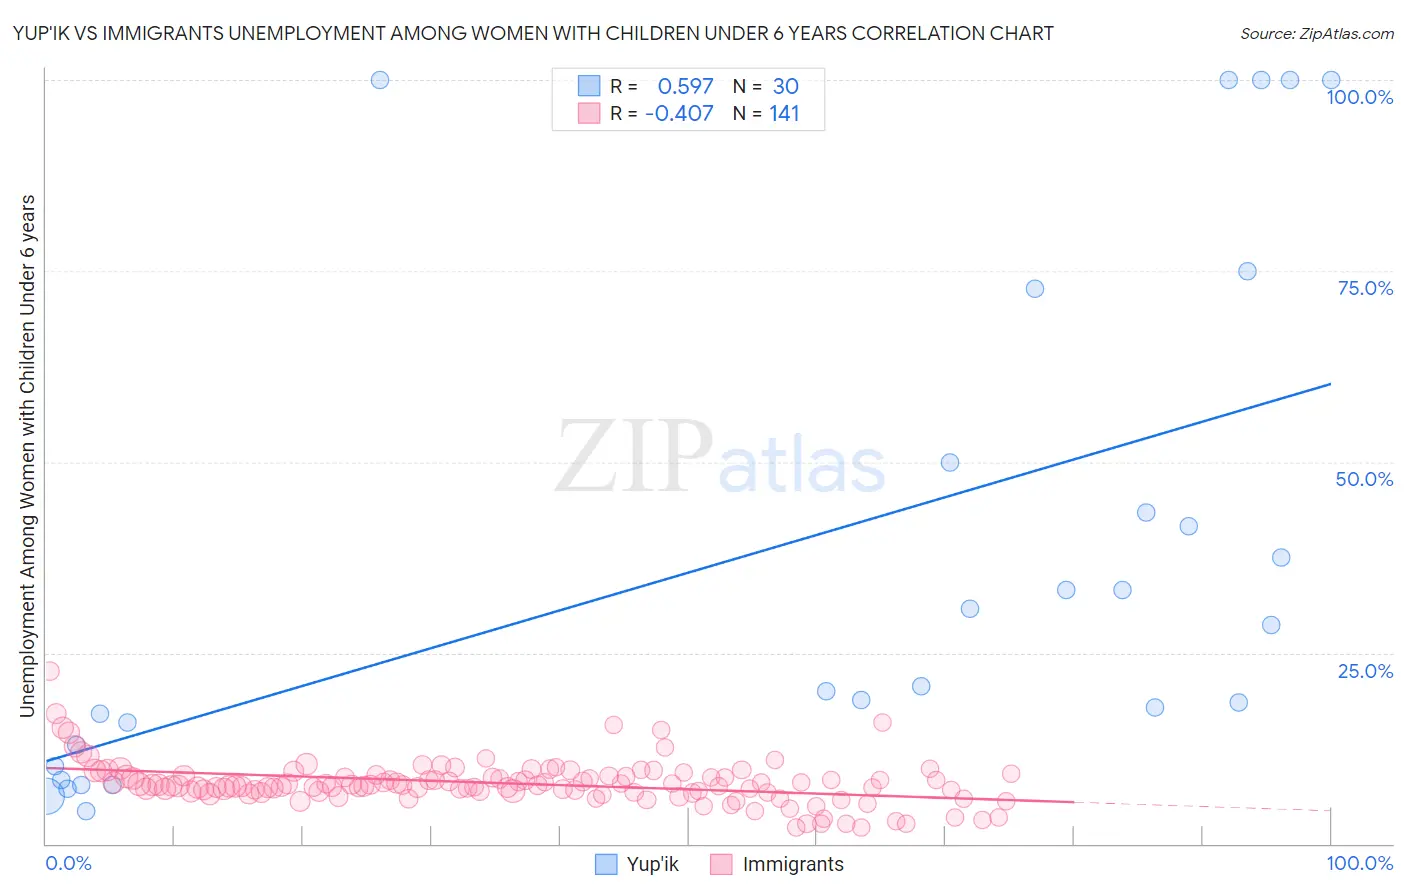
Yup'ik vs Immigrants Unemployment Among Women with Children Under 6 years Correlation Chart

The statistical analysis conducted on geographies consisting of 36,929,560 people shows a substantial positive correlation between the proportion of Yup'ik and unemployment rate among women with children under the age of 6 in the United States with a correlation coefficient (R) of 0.597 and weighted average of 21.1%. Similarly, the statistical analysis conducted on geographies consisting of 380,514,538 people shows a moderate negative correlation between the proportion of Immigrants and unemployment rate among women with children under the age of 6 in the United States with a correlation coefficient (R) of -0.407 and weighted average of 7.8%, a difference of 169.6%.
Yup'ik vs Immigrants Unemployment Among Women with Children Under 6 years

Unemployment Among Women with Children Under 6 years Correlation Summary

MeasurementYup'ikImmigrants
Minimum4.2%2.1%
Maximum100.0%22.6%
Range95.8%20.5%
Mean38.0%7.9%
Median24.6%7.7%
Interquartile 25% (IQ1)12.9%6.8%
Interquartile 75% (IQ3)50.0%8.8%
Interquartile Range (IQR)37.1%2.1%
Standard Deviation (Sample)33.3%2.9%
Standard Deviation (Population)32.7%2.9%

Similar Demographics by Unemployment Among Women with Children Under 6 years

Demographics Similar to Yup'ik by Unemployment Among Women with Children Under 6 years

In terms of unemployment among women with children under 6 years, the demographic groups most similar to Yup'ik are Arapaho (19.0%, a difference of 10.6%), Inupiat (17.7%, a difference of 18.9%), Hopi (16.8%, a difference of 25.5%), Crow (14.6%, a difference of 43.8%), and Yuman (14.6%, a difference of 44.0%).
DemographicsRating | RankUnemployment Among Women with Children Under 6 years
Natives/Alaskans
0.0
/100
|
#333
Tragic
11.5%
Apache
0.0
/100
|
#334
Tragic
12.3%
Puerto Ricans
0.0
/100
|
#335
Tragic
12.5%
Shoshone
0.0
/100
|
#336
Tragic
13.2%
Chippewa
0.0
/100
|
#337
Tragic
13.3%
Pima
0.0
/100
|
#338
Tragic
13.4%
Navajo
0.0
/100
|
#339
Tragic
13.5%
Immigrants | Yemen
0.0
/100
|
#340
Tragic
13.5%
Lumbee
0.0
/100
|
#341
Tragic
13.8%
Yuman
0.0
/100
|
#342
Tragic
14.6%
Crow
0.0
/100
|
#343
Tragic
14.6%
Hopi
0.0
/100
|
#344
Tragic
16.8%
Inupiat
0.0
/100
|
#345
Tragic
17.7%
Arapaho
0.0
/100
|
#346
Tragic
19.0%
Yup'ik
0.0
/100
|
#347
Tragic
21.1%

Demographics Similar to Immigrants by Unemployment Among Women with Children Under 6 years

In terms of unemployment among women with children under 6 years, the demographic groups most similar to Immigrants are Hungarian (7.8%, a difference of 0.020%), Canadian (7.8%, a difference of 0.070%), Lebanese (7.8%, a difference of 0.080%), Spaniard (7.8%, a difference of 0.18%), and Sudanese (7.8%, a difference of 0.20%).
DemographicsRating | RankUnemployment Among Women with Children Under 6 years
Lithuanians
30.0
/100
|
#198
Fair
7.8%
Immigrants | Poland
27.3
/100
|
#199
Fair
7.8%
Guamanians/Chamorros
25.5
/100
|
#200
Fair
7.8%
Basques
24.7
/100
|
#201
Fair
7.8%
Sudanese
23.5
/100
|
#202
Fair
7.8%
Spaniards
23.3
/100
|
#203
Fair
7.8%
Lebanese
22.2
/100
|
#204
Fair
7.8%
Immigrants | Immigrants
21.4
/100
|
#205
Fair
7.8%
Hungarians
21.2
/100
|
#206
Fair
7.8%
Canadians
20.6
/100
|
#207
Fair
7.8%
Immigrants | Syria
18.9
/100
|
#208
Poor
7.8%
Costa Ricans
17.6
/100
|
#209
Poor
7.8%
Poles
16.0
/100
|
#210
Poor
7.9%
Immigrants | Ecuador
14.9
/100
|
#211
Poor
7.9%
Swiss
12.3
/100
|
#212
Poor
7.9%