Yup'ik vs Honduran Unemployment Among Ages 55 to 59 years
COMPARE
Yup'ik
Honduran
Unemployment Among Ages 55 to 59 years
Unemployment Among Ages 55 to 59 years Comparison
Yup'ik
Hondurans
13.9%
UNEMPLOYMENT AMONG AGES 55 TO 59 YEARS
0.0/ 100
METRIC RATING
347th/ 347
METRIC RANK
5.1%
UNEMPLOYMENT AMONG AGES 55 TO 59 YEARS
0.7/ 100
METRIC RATING
243rd/ 347
METRIC RANK
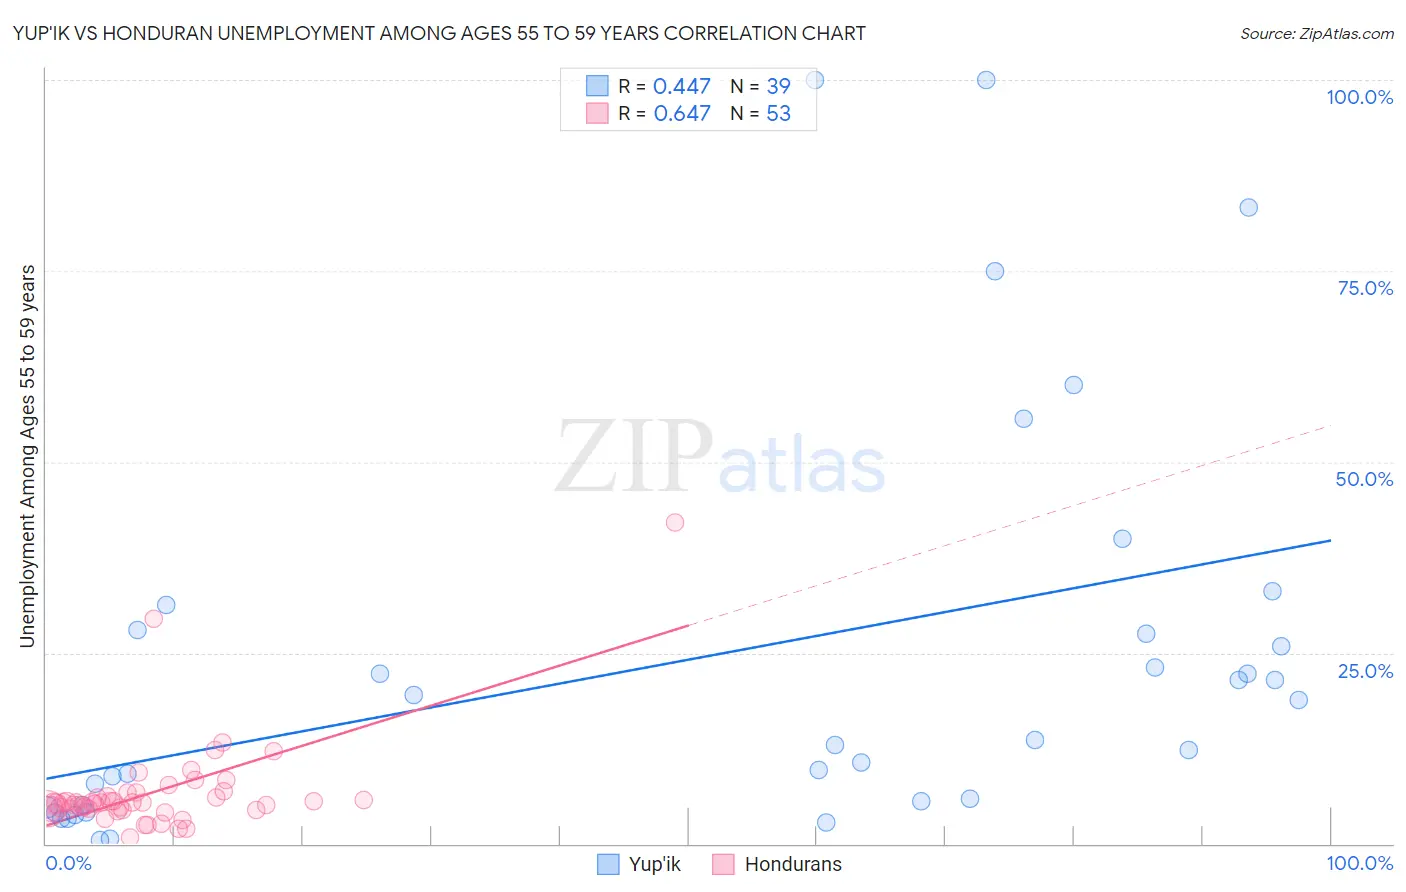
Yup'ik vs Honduran Unemployment Among Ages 55 to 59 years Correlation Chart
The statistical analysis conducted on geographies consisting of 39,073,104 people shows a moderate positive correlation between the proportion of Yup'ik and unemployment rate among population between the ages 55 and 59 in the United States with a correlation coefficient (R) of 0.447 and weighted average of 13.9%. Similarly, the statistical analysis conducted on geographies consisting of 335,038,242 people shows a significant positive correlation between the proportion of Hondurans and unemployment rate among population between the ages 55 and 59 in the United States with a correlation coefficient (R) of 0.647 and weighted average of 5.1%, a difference of 175.3%.
Unemployment Among Ages 55 to 59 years Correlation Summary
| Measurement | Yup'ik | Honduran |
| Minimum | 0.49% | 0.90% |
| Maximum | 100.0% | 42.1% |
| Range | 99.5% | 41.2% |
| Mean | 24.0% | 6.7% |
| Median | 13.6% | 5.3% |
| Interquartile 25% (IQ1) | 5.0% | 4.5% |
| Interquartile 75% (IQ3) | 28.0% | 6.4% |
| Interquartile Range (IQR) | 23.0% | 1.9% |
| Standard Deviation (Sample) | 26.6% | 6.4% |
| Standard Deviation (Population) | 26.3% | 6.3% |
Similar Demographics by Unemployment Among Ages 55 to 59 years
Demographics Similar to Yup'ik by Unemployment Among Ages 55 to 59 years
In terms of unemployment among ages 55 to 59 years, the demographic groups most similar to Yup'ik are Menominee (10.5%, a difference of 32.2%), Tohono O'odham (9.3%, a difference of 49.6%), Inupiat (9.0%, a difference of 54.2%), Yakama (8.9%, a difference of 56.0%), and Hopi (8.1%, a difference of 71.6%).
| Demographics | Rating | Rank | Unemployment Among Ages 55 to 59 years |
| Pima | 0.0 /100 | #333 | Tragic 6.6% |
| Pueblo | 0.0 /100 | #334 | Tragic 6.7% |
| Colville | 0.0 /100 | #335 | Tragic 6.7% |
| Navajo | 0.0 /100 | #336 | Tragic 6.7% |
| Paiute | 0.0 /100 | #337 | Tragic 6.8% |
| Immigrants | Yemen | 0.0 /100 | #338 | Tragic 6.9% |
| Puerto Ricans | 0.0 /100 | #339 | Tragic 7.0% |
| Alaskan Athabascans | 0.0 /100 | #340 | Tragic 7.1% |
| Shoshone | 0.0 /100 | #341 | Tragic 7.4% |
| Hopi | 0.0 /100 | #342 | Tragic 8.1% |
| Yakama | 0.0 /100 | #343 | Tragic 8.9% |
| Inupiat | 0.0 /100 | #344 | Tragic 9.0% |
| Tohono O'odham | 0.0 /100 | #345 | Tragic 9.3% |
| Menominee | 0.0 /100 | #346 | Tragic 10.5% |
| Yup'ik | 0.0 /100 | #347 | Tragic 13.9% |
Demographics Similar to Hondurans by Unemployment Among Ages 55 to 59 years
In terms of unemployment among ages 55 to 59 years, the demographic groups most similar to Hondurans are Immigrants from Fiji (5.1%, a difference of 0.010%), Liberian (5.1%, a difference of 0.21%), Soviet Union (5.1%, a difference of 0.23%), Immigrants from Greece (5.1%, a difference of 0.24%), and Immigrants from Honduras (5.1%, a difference of 0.25%).
| Demographics | Rating | Rank | Unemployment Among Ages 55 to 59 years |
| Immigrants | Albania | 1.3 /100 | #236 | Tragic 5.0% |
| Choctaw | 1.3 /100 | #237 | Tragic 5.0% |
| Moroccans | 1.3 /100 | #238 | Tragic 5.0% |
| French American Indians | 1.2 /100 | #239 | Tragic 5.0% |
| Immigrants | Costa Rica | 1.1 /100 | #240 | Tragic 5.0% |
| Brazilians | 1.0 /100 | #241 | Tragic 5.0% |
| Liberians | 0.9 /100 | #242 | Tragic 5.1% |
| Hondurans | 0.7 /100 | #243 | Tragic 5.1% |
| Immigrants | Fiji | 0.7 /100 | #244 | Tragic 5.1% |
| Soviet Union | 0.6 /100 | #245 | Tragic 5.1% |
| Immigrants | Greece | 0.6 /100 | #246 | Tragic 5.1% |
| Immigrants | Honduras | 0.5 /100 | #247 | Tragic 5.1% |
| Native Hawaiians | 0.5 /100 | #248 | Tragic 5.1% |
| Comanche | 0.4 /100 | #249 | Tragic 5.1% |
| Cheyenne | 0.4 /100 | #250 | Tragic 5.1% |