Yup'ik vs Hmong Unemployment Among Ages 45 to 54 years

COMPARE

Yup'ik
Race
Ancestry
AfghanAfricanAlaska NativeAlaskan AthabascanAlbanianAleutAlsatianAmericanApacheArabArapahoArgentineanArmenianAssyrian/Chaldean/SyriacAustralianAustrianBahamianBangladeshiBarbadianBasqueBelgianBelizeanBermudanBhutaneseBlackfeetBolivianBrazilianBritishBritish West IndianBulgarianBurmeseCajunCambodianCanadianCape VerdeanCarpatho RusynCelticCentral AmericanCentral American IndianCherokeeCheyenneChickasawChileanChineseChippewaChoctawColombianColvilleComancheCosta RicanCreeCreekCroatianCrowCubanCypriotCzechCzechoslovakianDanishDelawareDominicanDutchDutch West IndianEastern EuropeanEcuadorianEgyptianEnglishEstonianEthiopianEuropeanFijianFilipinoFinnishFrenchFrench American IndianFrench CanadianGermanGerman RussianGhanaianGreekGuamanian/ChamorroGuatemalanGuyaneseHaitianHonduranHopiHoumaHungarianIcelanderIndian (Asian)IndonesianInupiatIranianIraqiIrishIroquoisIsraeliItalianJamaicanJapaneseJordanianKenyanKiowaKoreanLaotianLatvianLebaneseLiberianLithuanianLumbeeLuxembourgerMacedonianMalaysianMalteseMarshalleseMenomineeMexicanMexican American IndianMongolianMoroccanNative HawaiianNavajoNepaleseNew ZealanderNicaraguanNigerianNorthern EuropeanNorwegianOkinawanOsageOttawaPaiutePakistaniPalestinianPanamanianParaguayanPennsylvania GermanPeruvianPimaPolishPortuguesePotawatomiPuebloPuerto RicanPuget Sound SalishRomanianRussianSalvadoranSamoanScandinavianScotch-IrishScottishSeminoleSenegaleseSerbianShoshoneSierra LeoneanSiouxSlavicSlovakSloveneSomaliSouth AfricanSouth AmericanSouth American IndianSoviet UnionSpaniardSpanishSpanish AmericanSpanish American IndianSri LankanSubsaharan AfricanSudaneseSwedishSwissSyrianTaiwaneseThaiTlingit-HaidaTohono O'OdhamTonganTrinidadian and TobagonianTsimshianTurkishU.S. Virgin IslanderUgandanUkrainianUruguayanUteVenezuelanVietnameseWelshWest IndianYakamaYaquiYugoslavianYumanYup'ikZimbabwean
Immigration
NonimmigrantsImmigrantsAfghanistanAfricaAlbaniaArgentinaArmeniaAsiaAustraliaAustriaBahamasBangladeshBarbadosBelarusBelgiumBelizeBoliviaBosnia and HerzegovinaBrazilBulgariaBurma/MyanmarCabo VerdeCambodiaCameroonCanadaCaribbeanCentral AmericaChileChinaColombiaCongoCosta RicaCroatiaCubaCzechoslovakiaDenmarkDominicaDominican RepublicEastern AfricaEastern AsiaEastern EuropeEcuadorEgyptEl SalvadorEnglandEritreaEthiopiaEuropeFijiFranceGermanyGhanaGreeceGrenadaGuatemalaGuyanaHaitiHondurasHong KongHungaryIndiaIndonesiaIranIraqIrelandIsraelItalyJamaicaJapanJordanKazakhstanKenyaKoreaKuwaitLaosLatin AmericaLatviaLebanonLiberiaLithuaniaMalaysiaMexicoMicronesiaMiddle AfricaMoldovaMoroccoNepalNetherlandsNicaraguaNigeriaNorth AmericaNorth MacedoniaNorthern AfricaNorthern EuropeNorwayOceaniaPakistanPanamaPeruPhilippinesPolandPortugalRomaniaRussiaSaudi ArabiaScotlandSenegalSerbiaSierra LeoneSingaporeSomaliaSouth AfricaSouth AmericaSouth Central AsiaSouth Eastern AsiaSouthern EuropeSpainSri LankaSt. Vincent and the GrenadinesSudanSwedenSwitzerlandSyriaTaiwanThailandTrinidad and TobagoTurkeyUgandaUkraineUruguayUzbekistanVenezuelaVietnamWest IndiesWestern AfricaWestern AsiaWestern EuropeYemenZaireZimbabweAzores
Hmong
Race
Ancestry
AfghanAfricanAlaska NativeAlaskan AthabascanAlbanianAleutAlsatianAmericanApacheArabArapahoArgentineanArmenianAssyrian/Chaldean/SyriacAustralianAustrianBahamianBangladeshiBarbadianBasqueBelgianBelizeanBermudanBhutaneseBlackfeetBolivianBrazilianBritishBritish West IndianBulgarianBurmeseCajunCambodianCanadianCape VerdeanCarpatho RusynCelticCentral AmericanCentral American IndianCherokeeCheyenneChickasawChileanChineseChippewaChoctawColombianColvilleComancheCosta RicanCreeCreekCroatianCrowCubanCypriotCzechCzechoslovakianDanishDelawareDominicanDutchDutch West IndianEastern EuropeanEcuadorianEgyptianEnglishEstonianEthiopianEuropeanFijianFilipinoFinnishFrenchFrench American IndianFrench CanadianGermanGerman RussianGhanaianGreekGuamanian/ChamorroGuatemalanGuyaneseHaitianHmongHonduranHopiHoumaHungarianIcelanderIndian (Asian)IndonesianInupiatIranianIraqiIrishIroquoisIsraeliItalianJamaicanJapaneseJordanianKenyanKiowaKoreanLaotianLatvianLebaneseLiberianLithuanianLumbeeLuxembourgerMacedonianMalaysianMalteseMarshalleseMenomineeMexicanMexican American IndianMongolianMoroccanNative HawaiianNavajoNepaleseNew ZealanderNicaraguanNigerianNorthern EuropeanNorwegianOkinawanOsageOttawaPaiutePakistaniPalestinianPanamanianParaguayanPennsylvania GermanPeruvianPimaPolishPortuguesePotawatomiPuebloPuerto RicanPuget Sound SalishRomanianRussianSalvadoranSamoanScandinavianScotch-IrishScottishSeminoleSenegaleseSerbianShoshoneSierra LeoneanSiouxSlavicSlovakSloveneSomaliSouth AfricanSouth AmericanSouth American IndianSoviet UnionSpaniardSpanishSpanish AmericanSpanish American IndianSri LankanSubsaharan AfricanSudaneseSwedishSwissSyrianTaiwaneseThaiTlingit-HaidaTohono O'OdhamTonganTrinidadian and TobagonianTsimshianTurkishU.S. Virgin IslanderUgandanUkrainianUruguayanUteVenezuelanVietnameseWelshWest IndianYakamaYaquiYugoslavianYumanZimbabwean
Immigration
NonimmigrantsImmigrantsAfghanistanAfricaAlbaniaArgentinaArmeniaAsiaAustraliaAustriaBahamasBangladeshBarbadosBelarusBelgiumBelizeBoliviaBosnia and HerzegovinaBrazilBulgariaBurma/MyanmarCabo VerdeCambodiaCameroonCanadaCaribbeanCentral AmericaChileChinaColombiaCongoCosta RicaCroatiaCubaCzechoslovakiaDenmarkDominicaDominican RepublicEastern AfricaEastern AsiaEastern EuropeEcuadorEgyptEl SalvadorEnglandEritreaEthiopiaEuropeFijiFranceGermanyGhanaGreeceGrenadaGuatemalaGuyanaHaitiHondurasHong KongHungaryIndiaIndonesiaIranIraqIrelandIsraelItalyJamaicaJapanJordanKazakhstanKenyaKoreaKuwaitLaosLatin AmericaLatviaLebanonLiberiaLithuaniaMalaysiaMexicoMicronesiaMiddle AfricaMoldovaMoroccoNepalNetherlandsNicaraguaNigeriaNorth AmericaNorth MacedoniaNorthern AfricaNorthern EuropeNorwayOceaniaPakistanPanamaPeruPhilippinesPolandPortugalRomaniaRussiaSaudi ArabiaScotlandSenegalSerbiaSierra LeoneSingaporeSomaliaSouth AfricaSouth AmericaSouth Central AsiaSouth Eastern AsiaSouthern EuropeSpainSri LankaSt. Vincent and the GrenadinesSudanSwedenSwitzerlandSyriaTaiwanThailandTrinidad and TobagoTurkeyUgandaUkraineUruguayUzbekistanVenezuelaVietnamWest IndiesWestern AfricaWestern AsiaWestern EuropeYemenZaireZimbabweAzores
Unemployment Among Ages 45 to 54 years
Income
Poverty
Unemployment
Labor Participation
Family Structure
Vehicle Availability
Education Level
Disability

Unemployment Among Ages 45 to 54 years Comparison

Yup'ik

Hmong

Tragic
Exceptional
11.9%
UNEMPLOYMENT AMONG AGES 45 TO 54 YEARS
0.0/ 100
METRIC RATING
346th/ 347
METRIC RANK
3.7%
UNEMPLOYMENT AMONG AGES 45 TO 54 YEARS
100.0/ 100
METRIC RATING
1st/ 347
METRIC RANK

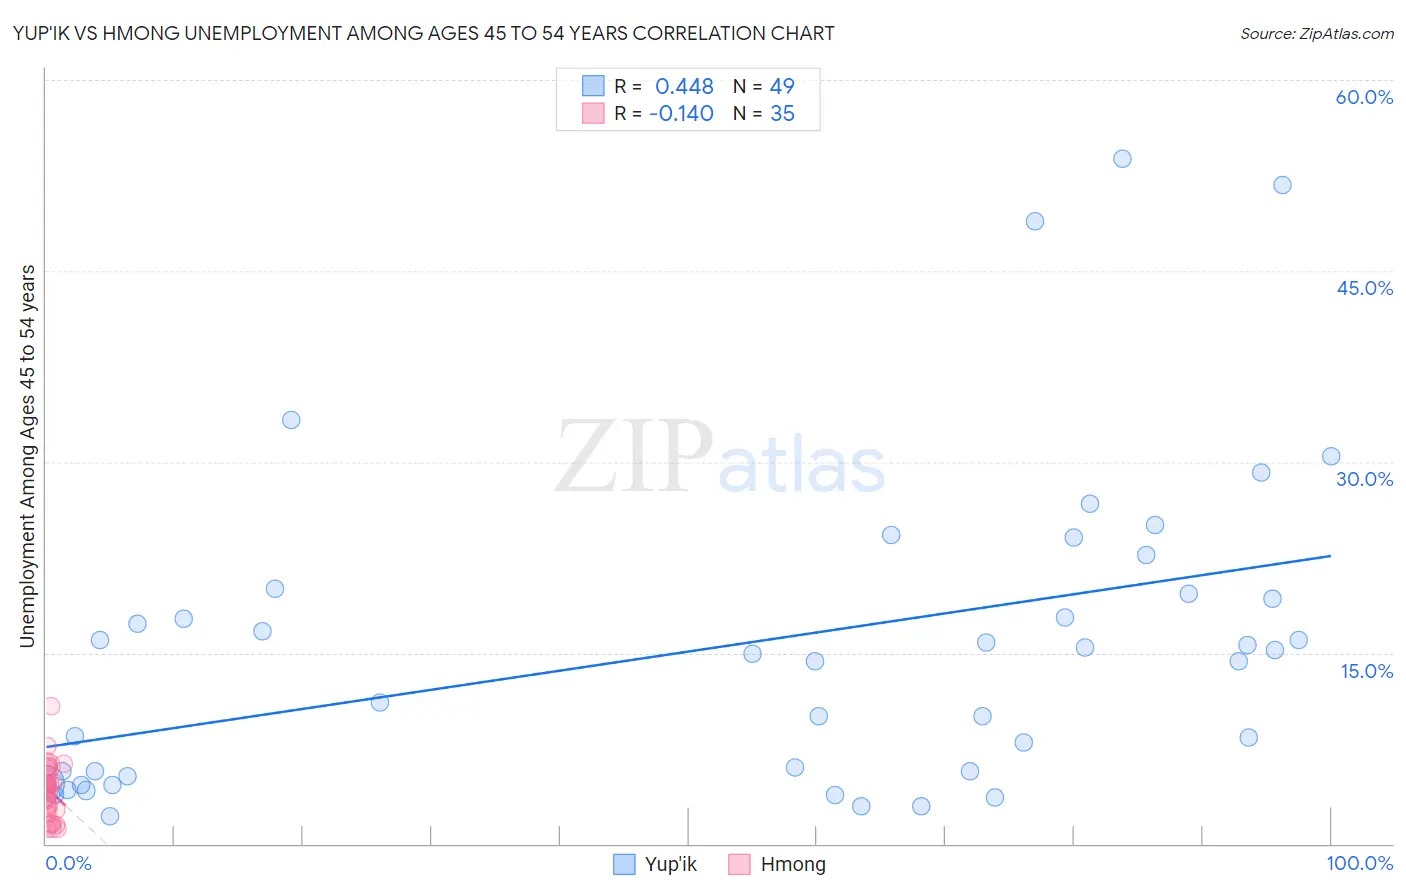
Yup'ik vs Hmong Unemployment Among Ages 45 to 54 years Correlation Chart

The statistical analysis conducted on geographies consisting of 39,649,557 people shows a moderate positive correlation between the proportion of Yup'ik and unemployment rate among population between the ages 45 and 54 in the United States with a correlation coefficient (R) of 0.448 and weighted average of 11.9%. Similarly, the statistical analysis conducted on geographies consisting of 24,607,345 people shows a poor negative correlation between the proportion of Hmong and unemployment rate among population between the ages 45 and 54 in the United States with a correlation coefficient (R) of -0.140 and weighted average of 3.7%, a difference of 218.1%.
Yup'ik vs Hmong Unemployment Among Ages 45 to 54 years

Unemployment Among Ages 45 to 54 years Correlation Summary

MeasurementYup'ikHmong
Minimum2.1%1.2%
Maximum53.8%10.8%
Range51.7%9.6%
Mean15.5%4.2%
Median14.9%4.3%
Interquartile 25% (IQ1)5.5%2.7%
Interquartile 75% (IQ3)19.8%5.9%
Interquartile Range (IQR)14.3%3.2%
Standard Deviation (Sample)12.4%2.1%
Standard Deviation (Population)12.2%2.1%

Similar Demographics by Unemployment Among Ages 45 to 54 years

Demographics Similar to Yup'ik by Unemployment Among Ages 45 to 54 years

In terms of unemployment among ages 45 to 54 years, the demographic groups most similar to Yup'ik are Cheyenne (10.6%, a difference of 12.5%), Crow (13.7%, a difference of 15.7%), Yuman (9.5%, a difference of 25.2%), Inupiat (9.2%, a difference of 29.3%), and Alaskan Athabascan (8.5%, a difference of 40.4%).
DemographicsRating | RankUnemployment Among Ages 45 to 54 years
Immigrants | Yemen
0.0
/100
|
#333
Tragic
6.5%
Sioux
0.0
/100
|
#334
Tragic
6.6%
Navajo
0.0
/100
|
#335
Tragic
6.7%
Puerto Ricans
0.0
/100
|
#336
Tragic
6.8%
Apache
0.0
/100
|
#337
Tragic
7.0%
Colville
0.0
/100
|
#338
Tragic
7.4%
Arapaho
0.0
/100
|
#339
Tragic
7.5%
Hopi
0.0
/100
|
#340
Tragic
7.5%
Paiute
0.0
/100
|
#341
Tragic
7.8%
Alaskan Athabascans
0.0
/100
|
#342
Tragic
8.5%
Inupiat
0.0
/100
|
#343
Tragic
9.2%
Yuman
0.0
/100
|
#344
Tragic
9.5%
Cheyenne
0.0
/100
|
#345
Tragic
10.6%
Yup'ik
0.0
/100
|
#346
Tragic
11.9%
Crow
0.0
/100
|
#347
Tragic
13.7%

Demographics Similar to Hmong by Unemployment Among Ages 45 to 54 years

In terms of unemployment among ages 45 to 54 years, the demographic groups most similar to Hmong are Fijian (3.8%, a difference of 0.78%), Norwegian (3.9%, a difference of 3.1%), Immigrants from India (3.9%, a difference of 4.0%), Danish (3.9%, a difference of 4.2%), and Immigrants from Cuba (3.9%, a difference of 4.4%).
DemographicsRating | RankUnemployment Among Ages 45 to 54 years
Hmong
100.0
/100
|
#1
Exceptional
3.7%
Fijians
100.0
/100
|
#2
Exceptional
3.8%
Norwegians
100.0
/100
|
#3
Exceptional
3.9%
Immigrants | India
100.0
/100
|
#4
Exceptional
3.9%
Danes
100.0
/100
|
#5
Exceptional
3.9%
Immigrants | Cuba
100.0
/100
|
#6
Exceptional
3.9%
Immigrants | Venezuela
100.0
/100
|
#7
Exceptional
3.9%
Chinese
100.0
/100
|
#8
Exceptional
4.0%
Czechs
100.0
/100
|
#9
Exceptional
4.0%
Venezuelans
100.0
/100
|
#10
Exceptional
4.0%
Scandinavians
100.0
/100
|
#11
Exceptional
4.0%
Swedes
100.0
/100
|
#12
Exceptional
4.0%
Cubans
100.0
/100
|
#13
Exceptional
4.0%
Immigrants | Bosnia and Herzegovina
100.0
/100
|
#14
Exceptional
4.0%
Immigrants | Bolivia
100.0
/100
|
#15
Exceptional
4.0%