Yup'ik vs Bhutanese Unemployment Among Ages 45 to 54 years
COMPARE
Yup'ik
Bhutanese
Unemployment Among Ages 45 to 54 years
Unemployment Among Ages 45 to 54 years Comparison
Yup'ik
Bhutanese
11.9%
UNEMPLOYMENT AMONG AGES 45 TO 54 YEARS
0.0/ 100
METRIC RATING
346th/ 347
METRIC RANK
4.2%
UNEMPLOYMENT AMONG AGES 45 TO 54 YEARS
99.9/ 100
METRIC RATING
31st/ 347
METRIC RANK
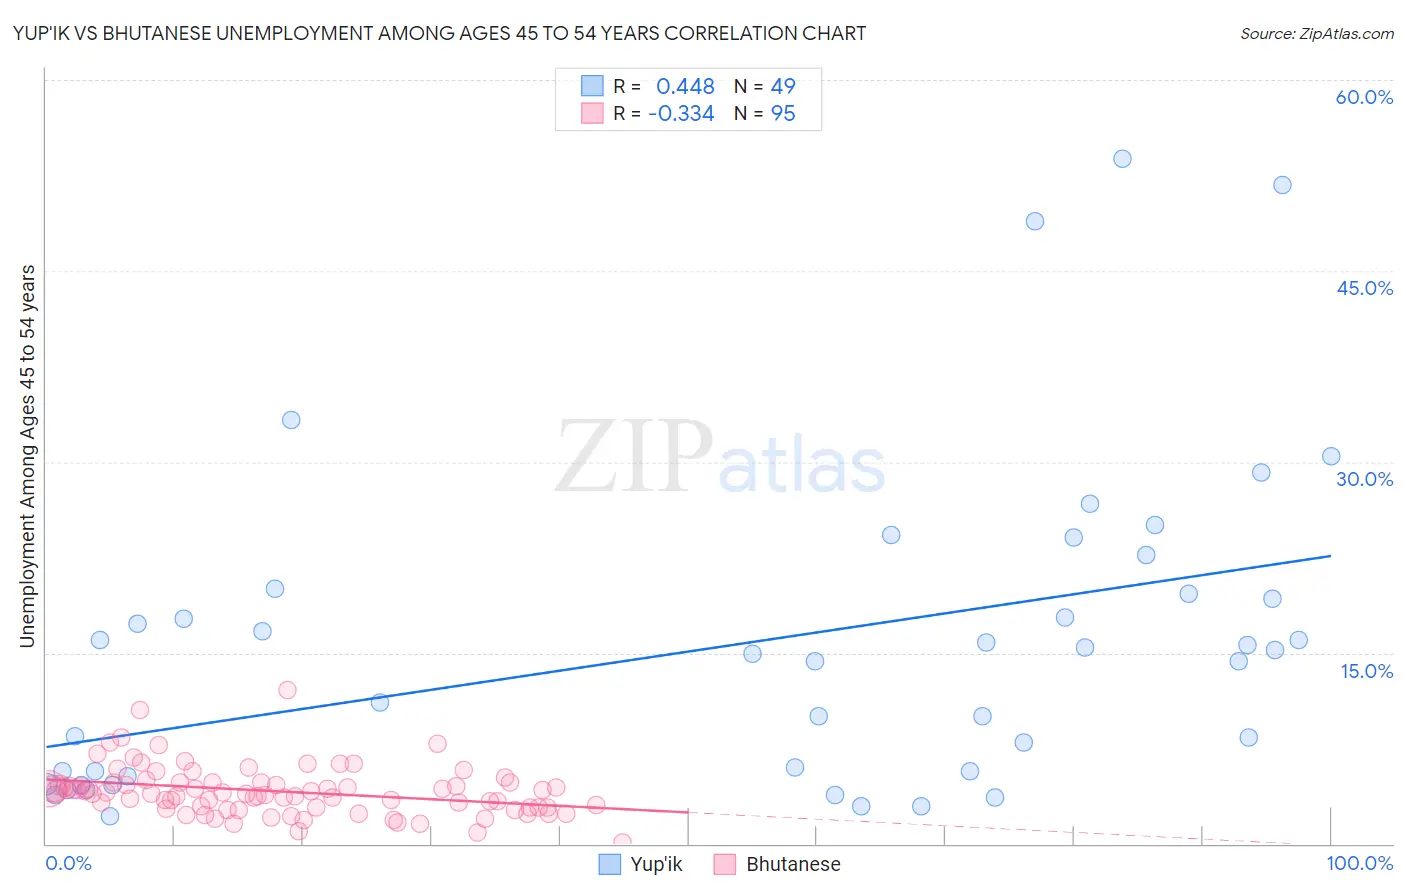
Yup'ik vs Bhutanese Unemployment Among Ages 45 to 54 years Correlation Chart
The statistical analysis conducted on geographies consisting of 39,649,557 people shows a moderate positive correlation between the proportion of Yup'ik and unemployment rate among population between the ages 45 and 54 in the United States with a correlation coefficient (R) of 0.448 and weighted average of 11.9%. Similarly, the statistical analysis conducted on geographies consisting of 440,206,537 people shows a mild negative correlation between the proportion of Bhutanese and unemployment rate among population between the ages 45 and 54 in the United States with a correlation coefficient (R) of -0.334 and weighted average of 4.2%, a difference of 186.3%.
Unemployment Among Ages 45 to 54 years Correlation Summary
| Measurement | Yup'ik | Bhutanese |
| Minimum | 2.1% | 0.10% |
| Maximum | 53.8% | 12.1% |
| Range | 51.7% | 12.0% |
| Mean | 15.5% | 4.1% |
| Median | 14.9% | 4.0% |
| Interquartile 25% (IQ1) | 5.5% | 2.8% |
| Interquartile 75% (IQ3) | 19.8% | 4.8% |
| Interquartile Range (IQR) | 14.3% | 2.0% |
| Standard Deviation (Sample) | 12.4% | 1.9% |
| Standard Deviation (Population) | 12.2% | 1.9% |
Similar Demographics by Unemployment Among Ages 45 to 54 years
Demographics Similar to Yup'ik by Unemployment Among Ages 45 to 54 years
In terms of unemployment among ages 45 to 54 years, the demographic groups most similar to Yup'ik are Cheyenne (10.6%, a difference of 12.5%), Crow (13.7%, a difference of 15.7%), Yuman (9.5%, a difference of 25.2%), Inupiat (9.2%, a difference of 29.3%), and Alaskan Athabascan (8.5%, a difference of 40.4%).
| Demographics | Rating | Rank | Unemployment Among Ages 45 to 54 years |
| Immigrants | Yemen | 0.0 /100 | #333 | Tragic 6.5% |
| Sioux | 0.0 /100 | #334 | Tragic 6.6% |
| Navajo | 0.0 /100 | #335 | Tragic 6.7% |
| Puerto Ricans | 0.0 /100 | #336 | Tragic 6.8% |
| Apache | 0.0 /100 | #337 | Tragic 7.0% |
| Colville | 0.0 /100 | #338 | Tragic 7.4% |
| Arapaho | 0.0 /100 | #339 | Tragic 7.5% |
| Hopi | 0.0 /100 | #340 | Tragic 7.5% |
| Paiute | 0.0 /100 | #341 | Tragic 7.8% |
| Alaskan Athabascans | 0.0 /100 | #342 | Tragic 8.5% |
| Inupiat | 0.0 /100 | #343 | Tragic 9.2% |
| Yuman | 0.0 /100 | #344 | Tragic 9.5% |
| Cheyenne | 0.0 /100 | #345 | Tragic 10.6% |
| Yup'ik | 0.0 /100 | #346 | Tragic 11.9% |
| Crow | 0.0 /100 | #347 | Tragic 13.7% |
Demographics Similar to Bhutanese by Unemployment Among Ages 45 to 54 years
In terms of unemployment among ages 45 to 54 years, the demographic groups most similar to Bhutanese are British (4.1%, a difference of 0.020%), Belgian (4.1%, a difference of 0.030%), Slovene (4.2%, a difference of 0.11%), Immigrants from South Central Asia (4.2%, a difference of 0.13%), and Welsh (4.1%, a difference of 0.17%).
| Demographics | Rating | Rank | Unemployment Among Ages 45 to 54 years |
| Carpatho Rusyns | 100.0 /100 | #24 | Exceptional 4.1% |
| Bolivians | 99.9 /100 | #25 | Exceptional 4.1% |
| Scottish | 99.9 /100 | #26 | Exceptional 4.1% |
| Immigrants | Moldova | 99.9 /100 | #27 | Exceptional 4.1% |
| Welsh | 99.9 /100 | #28 | Exceptional 4.1% |
| Belgians | 99.9 /100 | #29 | Exceptional 4.1% |
| British | 99.9 /100 | #30 | Exceptional 4.1% |
| Bhutanese | 99.9 /100 | #31 | Exceptional 4.2% |
| Slovenes | 99.9 /100 | #32 | Exceptional 4.2% |
| Immigrants | South Central Asia | 99.9 /100 | #33 | Exceptional 4.2% |
| Dutch | 99.9 /100 | #34 | Exceptional 4.2% |
| Immigrants | Taiwan | 99.8 /100 | #35 | Exceptional 4.2% |
| Croatians | 99.8 /100 | #36 | Exceptional 4.2% |
| Osage | 99.8 /100 | #37 | Exceptional 4.2% |
| Scotch-Irish | 99.8 /100 | #38 | Exceptional 4.2% |