Jamaican vs Hmong Unemployment Among Ages 45 to 54 years
COMPARE
Jamaican
Hmong
Unemployment Among Ages 45 to 54 years
Unemployment Among Ages 45 to 54 years Comparison
Jamaicans
Hmong
5.3%
UNEMPLOYMENT AMONG AGES 45 TO 54 YEARS
0.0/ 100
METRIC RATING
295th/ 347
METRIC RANK
3.7%
UNEMPLOYMENT AMONG AGES 45 TO 54 YEARS
100.0/ 100
METRIC RATING
1st/ 347
METRIC RANK
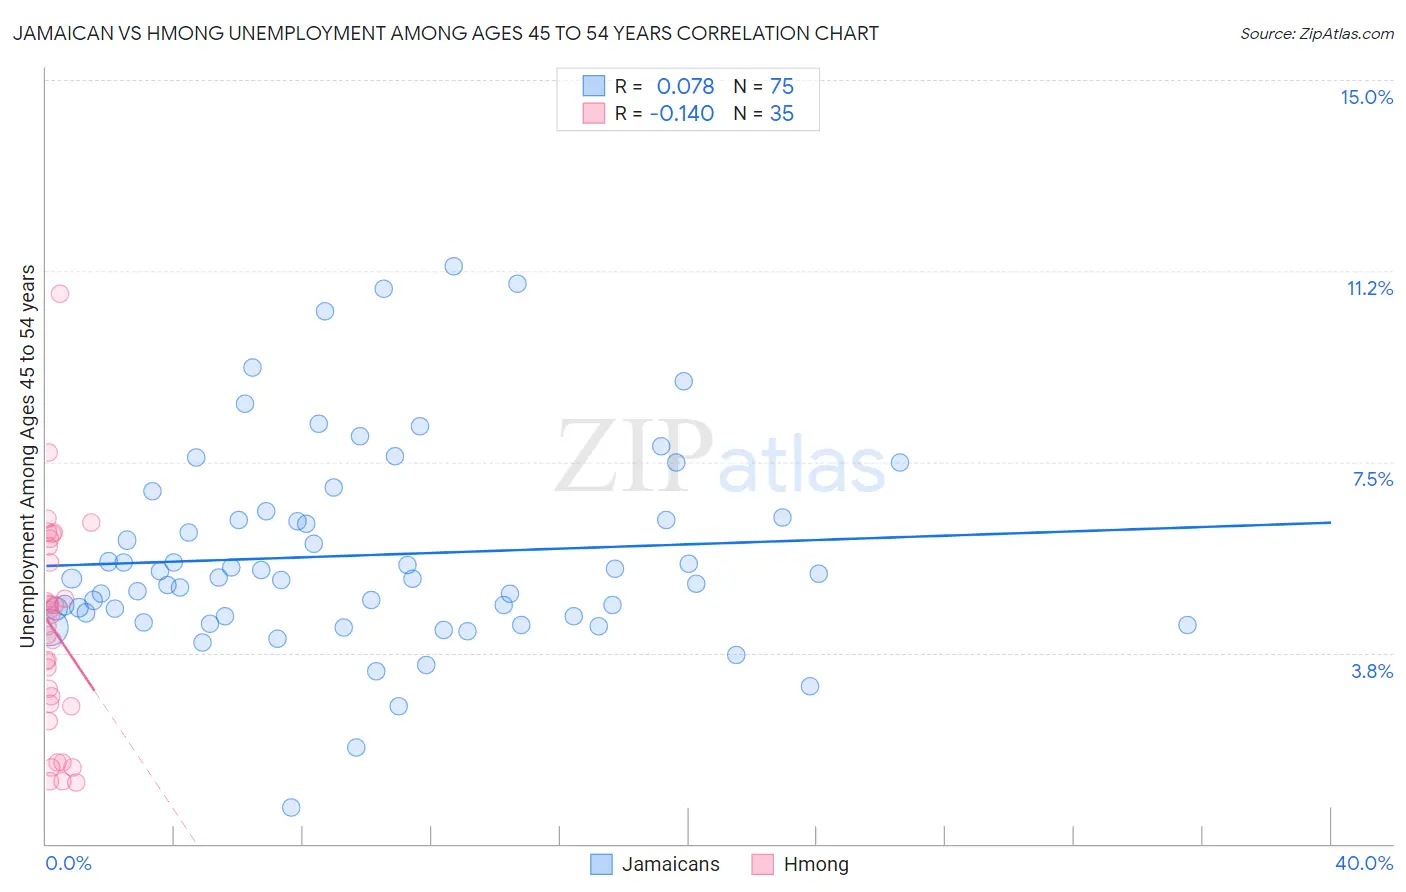
Jamaican vs Hmong Unemployment Among Ages 45 to 54 years Correlation Chart
The statistical analysis conducted on geographies consisting of 359,919,421 people shows a slight positive correlation between the proportion of Jamaicans and unemployment rate among population between the ages 45 and 54 in the United States with a correlation coefficient (R) of 0.078 and weighted average of 5.3%. Similarly, the statistical analysis conducted on geographies consisting of 24,607,345 people shows a poor negative correlation between the proportion of Hmong and unemployment rate among population between the ages 45 and 54 in the United States with a correlation coefficient (R) of -0.140 and weighted average of 3.7%, a difference of 40.6%.
Unemployment Among Ages 45 to 54 years Correlation Summary
| Measurement | Jamaican | Hmong |
| Minimum | 0.70% | 1.2% |
| Maximum | 11.3% | 10.8% |
| Range | 10.6% | 9.6% |
| Mean | 5.7% | 4.2% |
| Median | 5.2% | 4.3% |
| Interquartile 25% (IQ1) | 4.5% | 2.7% |
| Interquartile 75% (IQ3) | 6.4% | 5.9% |
| Interquartile Range (IQR) | 2.0% | 3.2% |
| Standard Deviation (Sample) | 2.0% | 2.1% |
| Standard Deviation (Population) | 2.0% | 2.1% |
Similar Demographics by Unemployment Among Ages 45 to 54 years
Demographics Similar to Jamaicans by Unemployment Among Ages 45 to 54 years
In terms of unemployment among ages 45 to 54 years, the demographic groups most similar to Jamaicans are Belizean (5.2%, a difference of 0.15%), Aleut (5.3%, a difference of 0.18%), West Indian (5.3%, a difference of 0.19%), Immigrants from Trinidad and Tobago (5.3%, a difference of 0.31%), and Ecuadorian (5.3%, a difference of 0.33%).
| Demographics | Rating | Rank | Unemployment Among Ages 45 to 54 years |
| Immigrants | Caribbean | 0.0 /100 | #288 | Tragic 5.2% |
| Immigrants | Haiti | 0.0 /100 | #289 | Tragic 5.2% |
| Immigrants | Portugal | 0.0 /100 | #290 | Tragic 5.2% |
| Armenians | 0.0 /100 | #291 | Tragic 5.2% |
| Trinidadians and Tobagonians | 0.0 /100 | #292 | Tragic 5.2% |
| Immigrants | Senegal | 0.0 /100 | #293 | Tragic 5.2% |
| Belizeans | 0.0 /100 | #294 | Tragic 5.2% |
| Jamaicans | 0.0 /100 | #295 | Tragic 5.3% |
| Aleuts | 0.0 /100 | #296 | Tragic 5.3% |
| West Indians | 0.0 /100 | #297 | Tragic 5.3% |
| Immigrants | Trinidad and Tobago | 0.0 /100 | #298 | Tragic 5.3% |
| Ecuadorians | 0.0 /100 | #299 | Tragic 5.3% |
| Central American Indians | 0.0 /100 | #300 | Tragic 5.3% |
| Menominee | 0.0 /100 | #301 | Tragic 5.3% |
| Immigrants | Ecuador | 0.0 /100 | #302 | Tragic 5.3% |
Demographics Similar to Hmong by Unemployment Among Ages 45 to 54 years
In terms of unemployment among ages 45 to 54 years, the demographic groups most similar to Hmong are Fijian (3.8%, a difference of 0.78%), Norwegian (3.9%, a difference of 3.1%), Immigrants from India (3.9%, a difference of 4.0%), Danish (3.9%, a difference of 4.2%), and Immigrants from Cuba (3.9%, a difference of 4.4%).
| Demographics | Rating | Rank | Unemployment Among Ages 45 to 54 years |
| Hmong | 100.0 /100 | #1 | Exceptional 3.7% |
| Fijians | 100.0 /100 | #2 | Exceptional 3.8% |
| Norwegians | 100.0 /100 | #3 | Exceptional 3.9% |
| Immigrants | India | 100.0 /100 | #4 | Exceptional 3.9% |
| Danes | 100.0 /100 | #5 | Exceptional 3.9% |
| Immigrants | Cuba | 100.0 /100 | #6 | Exceptional 3.9% |
| Immigrants | Venezuela | 100.0 /100 | #7 | Exceptional 3.9% |
| Chinese | 100.0 /100 | #8 | Exceptional 4.0% |
| Czechs | 100.0 /100 | #9 | Exceptional 4.0% |
| Venezuelans | 100.0 /100 | #10 | Exceptional 4.0% |
| Scandinavians | 100.0 /100 | #11 | Exceptional 4.0% |
| Swedes | 100.0 /100 | #12 | Exceptional 4.0% |
| Cubans | 100.0 /100 | #13 | Exceptional 4.0% |
| Immigrants | Bosnia and Herzegovina | 100.0 /100 | #14 | Exceptional 4.0% |
| Immigrants | Bolivia | 100.0 /100 | #15 | Exceptional 4.0% |