Yugoslavian vs Sierra Leonean Female Unemployment
COMPARE
Yugoslavian
Sierra Leonean
Female Unemployment
Female Unemployment Comparison
Yugoslavians
Sierra Leoneans
4.8%
FEMALE UNEMPLOYMENT
99.7/ 100
METRIC RATING
36th/ 347
METRIC RANK
5.5%
FEMALE UNEMPLOYMENT
3.2/ 100
METRIC RATING
238th/ 347
METRIC RANK
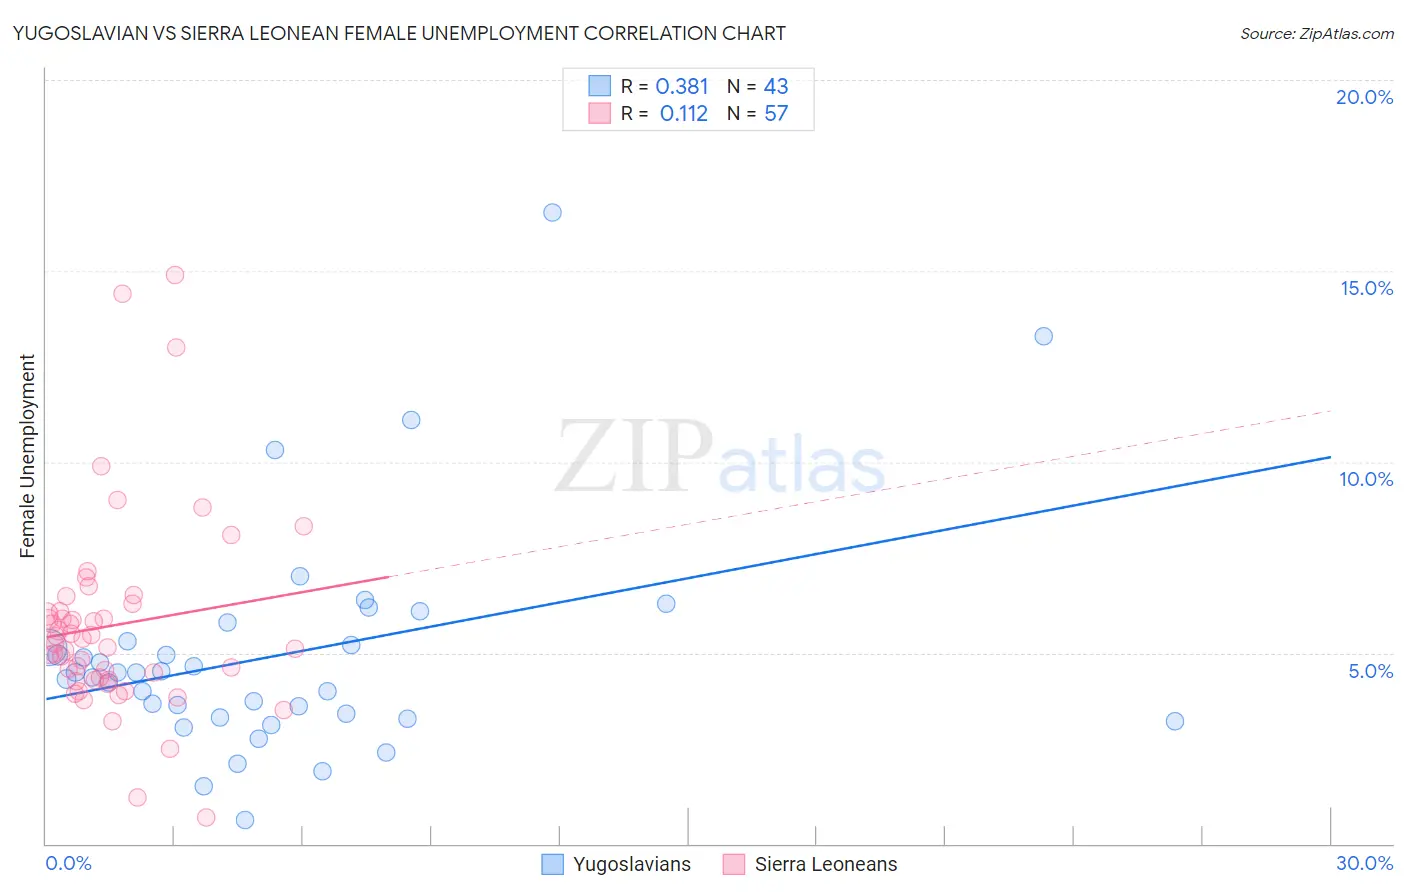
Yugoslavian vs Sierra Leonean Female Unemployment Correlation Chart
The statistical analysis conducted on geographies consisting of 284,681,231 people shows a mild positive correlation between the proportion of Yugoslavians and unemploymnet rate among females in the United States with a correlation coefficient (R) of 0.381 and weighted average of 4.8%. Similarly, the statistical analysis conducted on geographies consisting of 83,331,757 people shows a poor positive correlation between the proportion of Sierra Leoneans and unemploymnet rate among females in the United States with a correlation coefficient (R) of 0.112 and weighted average of 5.5%, a difference of 15.1%.
Female Unemployment Correlation Summary
| Measurement | Yugoslavian | Sierra Leonean |
| Minimum | 0.64% | 0.70% |
| Maximum | 16.5% | 14.9% |
| Range | 15.9% | 14.2% |
| Mean | 5.0% | 5.7% |
| Median | 4.5% | 5.2% |
| Interquartile 25% (IQ1) | 3.3% | 4.3% |
| Interquartile 75% (IQ3) | 5.3% | 6.2% |
| Interquartile Range (IQR) | 2.0% | 1.9% |
| Standard Deviation (Sample) | 3.0% | 2.6% |
| Standard Deviation (Population) | 2.9% | 2.6% |
Similar Demographics by Female Unemployment
Demographics Similar to Yugoslavians by Female Unemployment
In terms of female unemployment, the demographic groups most similar to Yugoslavians are French Canadian (4.8%, a difference of 0.15%), Zimbabwean (4.8%, a difference of 0.21%), Czechoslovakian (4.8%, a difference of 0.24%), Pennsylvania German (4.8%, a difference of 0.36%), and Northern European (4.8%, a difference of 0.47%).
| Demographics | Rating | Rank | Female Unemployment |
| Cypriots | 99.9 /100 | #29 | Exceptional 4.7% |
| Lithuanians | 99.8 /100 | #30 | Exceptional 4.7% |
| Sudanese | 99.8 /100 | #31 | Exceptional 4.8% |
| Slovaks | 99.8 /100 | #32 | Exceptional 4.8% |
| Czechoslovakians | 99.7 /100 | #33 | Exceptional 4.8% |
| Zimbabweans | 99.7 /100 | #34 | Exceptional 4.8% |
| French Canadians | 99.7 /100 | #35 | Exceptional 4.8% |
| Yugoslavians | 99.7 /100 | #36 | Exceptional 4.8% |
| Pennsylvania Germans | 99.6 /100 | #37 | Exceptional 4.8% |
| Northern Europeans | 99.6 /100 | #38 | Exceptional 4.8% |
| Scotch-Irish | 99.6 /100 | #39 | Exceptional 4.8% |
| French | 99.6 /100 | #40 | Exceptional 4.8% |
| Tongans | 99.5 /100 | #41 | Exceptional 4.8% |
| Italians | 99.5 /100 | #42 | Exceptional 4.8% |
| Eastern Europeans | 99.4 /100 | #43 | Exceptional 4.9% |
Demographics Similar to Sierra Leoneans by Female Unemployment
In terms of female unemployment, the demographic groups most similar to Sierra Leoneans are Immigrants from Panama (5.5%, a difference of 0.020%), Immigrants from Cambodia (5.5%, a difference of 0.040%), Immigrants from Lebanon (5.5%, a difference of 0.080%), Immigrants from Iran (5.5%, a difference of 0.080%), and Moroccan (5.5%, a difference of 0.10%).
| Demographics | Rating | Rank | Female Unemployment |
| Immigrants | Iraq | 3.9 /100 | #231 | Tragic 5.5% |
| Liberians | 3.9 /100 | #232 | Tragic 5.5% |
| Moroccans | 3.4 /100 | #233 | Tragic 5.5% |
| Immigrants | Lebanon | 3.3 /100 | #234 | Tragic 5.5% |
| Immigrants | Iran | 3.3 /100 | #235 | Tragic 5.5% |
| Immigrants | Cambodia | 3.3 /100 | #236 | Tragic 5.5% |
| Immigrants | Panama | 3.2 /100 | #237 | Tragic 5.5% |
| Sierra Leoneans | 3.2 /100 | #238 | Tragic 5.5% |
| Aleuts | 3.0 /100 | #239 | Tragic 5.5% |
| Immigrants | South America | 2.9 /100 | #240 | Tragic 5.5% |
| South American Indians | 2.8 /100 | #241 | Tragic 5.5% |
| Marshallese | 2.3 /100 | #242 | Tragic 5.6% |
| Spanish Americans | 2.2 /100 | #243 | Tragic 5.6% |
| Immigrants | Liberia | 1.5 /100 | #244 | Tragic 5.6% |
| Guamanians/Chamorros | 1.4 /100 | #245 | Tragic 5.6% |