Yugoslavian vs Serbian Female Unemployment
COMPARE
Yugoslavian
Serbian
Female Unemployment
Female Unemployment Comparison
Yugoslavians
Serbians
4.8%
FEMALE UNEMPLOYMENT
99.7/ 100
METRIC RATING
36th/ 347
METRIC RANK
4.9%
FEMALE UNEMPLOYMENT
99.0/ 100
METRIC RATING
56th/ 347
METRIC RANK
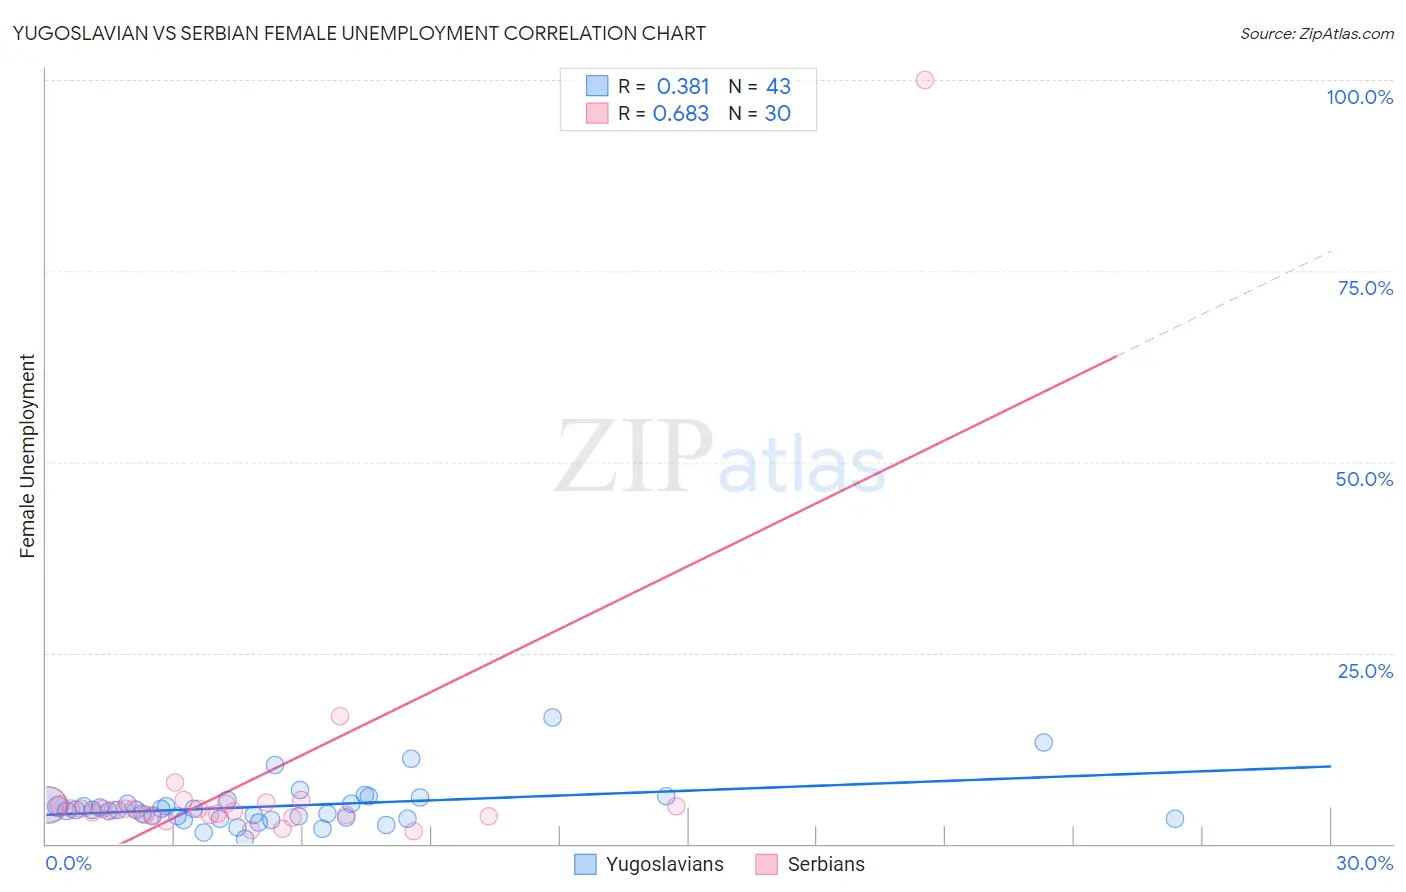
Yugoslavian vs Serbian Female Unemployment Correlation Chart
The statistical analysis conducted on geographies consisting of 284,681,231 people shows a mild positive correlation between the proportion of Yugoslavians and unemploymnet rate among females in the United States with a correlation coefficient (R) of 0.381 and weighted average of 4.8%. Similarly, the statistical analysis conducted on geographies consisting of 266,650,346 people shows a significant positive correlation between the proportion of Serbians and unemploymnet rate among females in the United States with a correlation coefficient (R) of 0.683 and weighted average of 4.9%, a difference of 2.0%.
Female Unemployment Correlation Summary
| Measurement | Yugoslavian | Serbian |
| Minimum | 0.64% | 1.7% |
| Maximum | 16.5% | 100.0% |
| Range | 15.9% | 98.3% |
| Mean | 5.0% | 7.9% |
| Median | 4.5% | 4.6% |
| Interquartile 25% (IQ1) | 3.3% | 3.7% |
| Interquartile 75% (IQ3) | 5.3% | 5.1% |
| Interquartile Range (IQR) | 2.0% | 1.4% |
| Standard Deviation (Sample) | 3.0% | 17.6% |
| Standard Deviation (Population) | 2.9% | 17.3% |
Demographics Similar to Yugoslavians and Serbians by Female Unemployment
In terms of female unemployment, the demographic groups most similar to Yugoslavians are Pennsylvania German (4.8%, a difference of 0.36%), Northern European (4.8%, a difference of 0.47%), Scotch-Irish (4.8%, a difference of 0.48%), French (4.8%, a difference of 0.52%), and Tongan (4.8%, a difference of 0.78%). Similarly, the demographic groups most similar to Serbians are Immigrants from Moldova (4.9%, a difference of 0.020%), Immigrants from Zimbabwe (4.9%, a difference of 0.030%), White/Caucasian (4.9%, a difference of 0.090%), Slavic (4.9%, a difference of 0.12%), and Cambodian (4.9%, a difference of 0.14%).
| Demographics | Rating | Rank | Female Unemployment |
| Yugoslavians | 99.7 /100 | #36 | Exceptional 4.8% |
| Pennsylvania Germans | 99.6 /100 | #37 | Exceptional 4.8% |
| Northern Europeans | 99.6 /100 | #38 | Exceptional 4.8% |
| Scotch-Irish | 99.6 /100 | #39 | Exceptional 4.8% |
| French | 99.6 /100 | #40 | Exceptional 4.8% |
| Tongans | 99.5 /100 | #41 | Exceptional 4.8% |
| Italians | 99.5 /100 | #42 | Exceptional 4.8% |
| Eastern Europeans | 99.4 /100 | #43 | Exceptional 4.9% |
| Greeks | 99.4 /100 | #44 | Exceptional 4.9% |
| Austrians | 99.3 /100 | #45 | Exceptional 4.9% |
| Immigrants | Bulgaria | 99.3 /100 | #46 | Exceptional 4.9% |
| Okinawans | 99.3 /100 | #47 | Exceptional 4.9% |
| Thais | 99.2 /100 | #48 | Exceptional 4.9% |
| Australians | 99.2 /100 | #49 | Exceptional 4.9% |
| Immigrants | Cuba | 99.1 /100 | #50 | Exceptional 4.9% |
| Cambodians | 99.1 /100 | #51 | Exceptional 4.9% |
| Slavs | 99.1 /100 | #52 | Exceptional 4.9% |
| Whites/Caucasians | 99.0 /100 | #53 | Exceptional 4.9% |
| Immigrants | Zimbabwe | 99.0 /100 | #54 | Exceptional 4.9% |
| Immigrants | Moldova | 99.0 /100 | #55 | Exceptional 4.9% |
| Serbians | 99.0 /100 | #56 | Exceptional 4.9% |