Yakama vs Immigrants from Jamaica Unemployment Among Ages 55 to 59 years
COMPARE
Yakama
Immigrants from Jamaica
Unemployment Among Ages 55 to 59 years
Unemployment Among Ages 55 to 59 years Comparison
Yakama
Immigrants from Jamaica
8.9%
UNEMPLOYMENT AMONG AGES 55 TO 59 YEARS
0.0/ 100
METRIC RATING
343rd/ 347
METRIC RANK
5.2%
UNEMPLOYMENT AMONG AGES 55 TO 59 YEARS
0.0/ 100
METRIC RATING
272nd/ 347
METRIC RANK
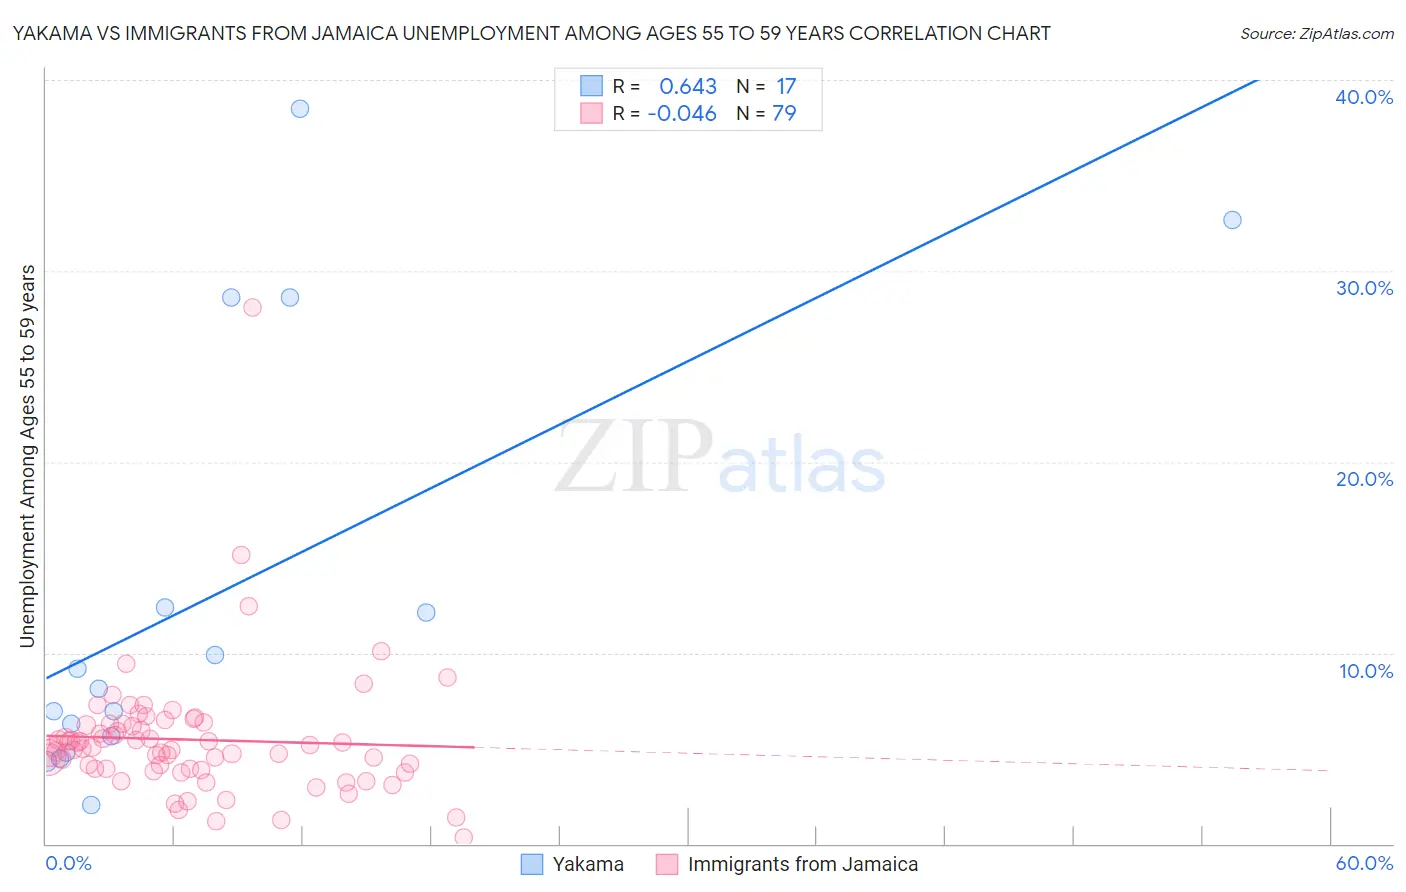
Yakama vs Immigrants from Jamaica Unemployment Among Ages 55 to 59 years Correlation Chart
The statistical analysis conducted on geographies consisting of 19,170,351 people shows a significant positive correlation between the proportion of Yakama and unemployment rate among population between the ages 55 and 59 in the United States with a correlation coefficient (R) of 0.643 and weighted average of 8.9%. Similarly, the statistical analysis conducted on geographies consisting of 285,867,428 people shows no correlation between the proportion of Immigrants from Jamaica and unemployment rate among population between the ages 55 and 59 in the United States with a correlation coefficient (R) of -0.046 and weighted average of 5.2%, a difference of 71.8%.
Unemployment Among Ages 55 to 59 years Correlation Summary
| Measurement | Yakama | Immigrants from Jamaica |
| Minimum | 2.0% | 0.30% |
| Maximum | 38.5% | 28.1% |
| Range | 36.5% | 27.8% |
| Mean | 13.0% | 5.5% |
| Median | 8.1% | 5.0% |
| Interquartile 25% (IQ1) | 5.2% | 3.9% |
| Interquartile 75% (IQ3) | 20.5% | 6.3% |
| Interquartile Range (IQR) | 15.3% | 2.4% |
| Standard Deviation (Sample) | 11.4% | 3.5% |
| Standard Deviation (Population) | 11.1% | 3.4% |
Similar Demographics by Unemployment Among Ages 55 to 59 years
Demographics Similar to Yakama by Unemployment Among Ages 55 to 59 years
In terms of unemployment among ages 55 to 59 years, the demographic groups most similar to Yakama are Inupiat (9.0%, a difference of 1.2%), Tohono O'odham (9.3%, a difference of 4.3%), Hopi (8.1%, a difference of 10.0%), Menominee (10.5%, a difference of 18.0%), and Shoshone (7.4%, a difference of 21.1%).
| Demographics | Rating | Rank | Unemployment Among Ages 55 to 59 years |
| Pima | 0.0 /100 | #333 | Tragic 6.6% |
| Pueblo | 0.0 /100 | #334 | Tragic 6.7% |
| Colville | 0.0 /100 | #335 | Tragic 6.7% |
| Navajo | 0.0 /100 | #336 | Tragic 6.7% |
| Paiute | 0.0 /100 | #337 | Tragic 6.8% |
| Immigrants | Yemen | 0.0 /100 | #338 | Tragic 6.9% |
| Puerto Ricans | 0.0 /100 | #339 | Tragic 7.0% |
| Alaskan Athabascans | 0.0 /100 | #340 | Tragic 7.1% |
| Shoshone | 0.0 /100 | #341 | Tragic 7.4% |
| Hopi | 0.0 /100 | #342 | Tragic 8.1% |
| Yakama | 0.0 /100 | #343 | Tragic 8.9% |
| Inupiat | 0.0 /100 | #344 | Tragic 9.0% |
| Tohono O'odham | 0.0 /100 | #345 | Tragic 9.3% |
| Menominee | 0.0 /100 | #346 | Tragic 10.5% |
| Yup'ik | 0.0 /100 | #347 | Tragic 13.9% |
Demographics Similar to Immigrants from Jamaica by Unemployment Among Ages 55 to 59 years
In terms of unemployment among ages 55 to 59 years, the demographic groups most similar to Immigrants from Jamaica are Cree (5.2%, a difference of 0.17%), Ottawa (5.2%, a difference of 0.23%), Mexican American Indian (5.2%, a difference of 0.35%), Israeli (5.2%, a difference of 0.45%), and West Indian (5.2%, a difference of 0.46%).
| Demographics | Rating | Rank | Unemployment Among Ages 55 to 59 years |
| Yaqui | 0.1 /100 | #265 | Tragic 5.2% |
| Jamaicans | 0.1 /100 | #266 | Tragic 5.2% |
| Immigrants | Senegal | 0.1 /100 | #267 | Tragic 5.2% |
| Mexicans | 0.1 /100 | #268 | Tragic 5.2% |
| Tsimshian | 0.1 /100 | #269 | Tragic 5.2% |
| Ute | 0.1 /100 | #270 | Tragic 5.2% |
| Cree | 0.1 /100 | #271 | Tragic 5.2% |
| Immigrants | Jamaica | 0.0 /100 | #272 | Tragic 5.2% |
| Ottawa | 0.0 /100 | #273 | Tragic 5.2% |
| Mexican American Indians | 0.0 /100 | #274 | Tragic 5.2% |
| Israelis | 0.0 /100 | #275 | Tragic 5.2% |
| West Indians | 0.0 /100 | #276 | Tragic 5.2% |
| Immigrants | Latin America | 0.0 /100 | #277 | Tragic 5.2% |
| Immigrants | Barbados | 0.0 /100 | #278 | Tragic 5.2% |
| Alsatians | 0.0 /100 | #279 | Tragic 5.2% |