West Indian vs Immigrants from Western Asia Unemployment Among Women with Children Under 18 years
COMPARE
West Indian
Immigrants from Western Asia
Unemployment Among Women with Children Under 18 years
Unemployment Among Women with Children Under 18 years Comparison
West Indians
Immigrants from Western Asia
6.3%
UNEMPLOYMENT AMONG WOMEN WITH CHILDREN UNDER 18 YEARS
0.0/ 100
METRIC RATING
283rd/ 347
METRIC RANK
5.6%
UNEMPLOYMENT AMONG WOMEN WITH CHILDREN UNDER 18 YEARS
11.3/ 100
METRIC RATING
209th/ 347
METRIC RANK
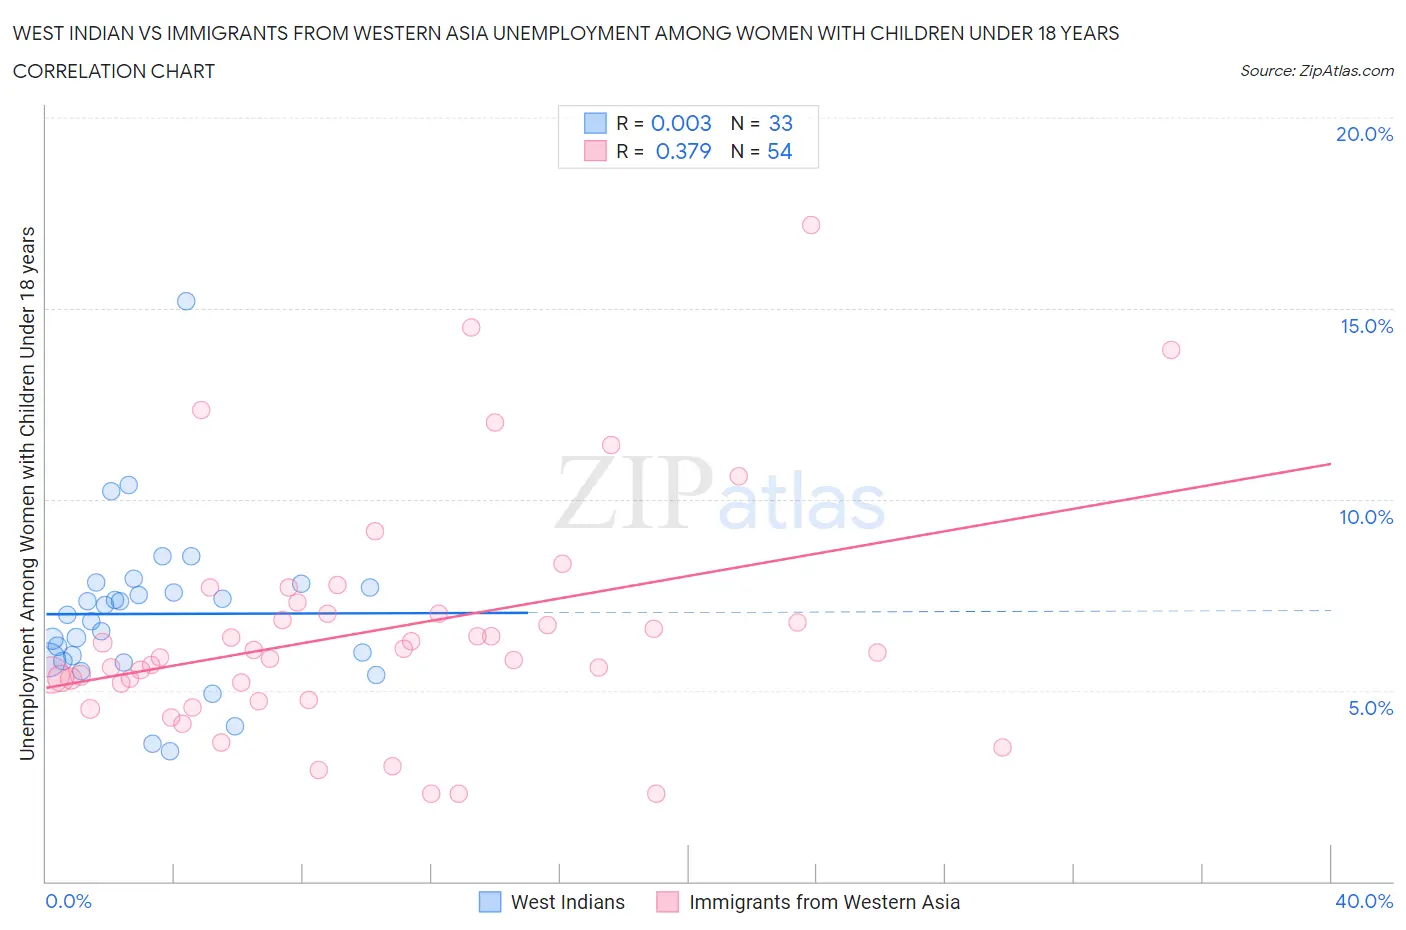
West Indian vs Immigrants from Western Asia Unemployment Among Women with Children Under 18 years Correlation Chart
The statistical analysis conducted on geographies consisting of 249,152,144 people shows no correlation between the proportion of West Indians and unemployment rate among women with children under the age of 18 in the United States with a correlation coefficient (R) of 0.003 and weighted average of 6.3%. Similarly, the statistical analysis conducted on geographies consisting of 389,254,890 people shows a mild positive correlation between the proportion of Immigrants from Western Asia and unemployment rate among women with children under the age of 18 in the United States with a correlation coefficient (R) of 0.379 and weighted average of 5.6%, a difference of 11.8%.
Unemployment Among Women with Children Under 18 years Correlation Summary
| Measurement | West Indian | Immigrants from Western Asia |
| Minimum | 3.4% | 2.3% |
| Maximum | 15.2% | 17.2% |
| Range | 11.8% | 14.9% |
| Mean | 7.0% | 6.6% |
| Median | 7.0% | 5.9% |
| Interquartile 25% (IQ1) | 5.8% | 5.2% |
| Interquartile 75% (IQ3) | 7.7% | 7.0% |
| Interquartile Range (IQR) | 2.0% | 1.8% |
| Standard Deviation (Sample) | 2.2% | 3.0% |
| Standard Deviation (Population) | 2.1% | 3.0% |
Similar Demographics by Unemployment Among Women with Children Under 18 years
Demographics Similar to West Indians by Unemployment Among Women with Children Under 18 years
In terms of unemployment among women with children under 18 years, the demographic groups most similar to West Indians are Immigrants from Grenada (6.3%, a difference of 0.030%), Immigrants from St. Vincent and the Grenadines (6.3%, a difference of 0.18%), Bahamian (6.3%, a difference of 0.18%), Immigrants from El Salvador (6.3%, a difference of 0.19%), and Alaskan Athabascan (6.3%, a difference of 0.33%).
| Demographics | Rating | Rank | Unemployment Among Women with Children Under 18 years |
| Immigrants | Ghana | 0.0 /100 | #276 | Tragic 6.2% |
| Mexican American Indians | 0.0 /100 | #277 | Tragic 6.2% |
| Immigrants | Barbados | 0.0 /100 | #278 | Tragic 6.2% |
| Immigrants | Portugal | 0.0 /100 | #279 | Tragic 6.3% |
| Guatemalans | 0.0 /100 | #280 | Tragic 6.3% |
| Immigrants | El Salvador | 0.0 /100 | #281 | Tragic 6.3% |
| Immigrants | St. Vincent and the Grenadines | 0.0 /100 | #282 | Tragic 6.3% |
| West Indians | 0.0 /100 | #283 | Tragic 6.3% |
| Immigrants | Grenada | 0.0 /100 | #284 | Tragic 6.3% |
| Bahamians | 0.0 /100 | #285 | Tragic 6.3% |
| Alaskan Athabascans | 0.0 /100 | #286 | Tragic 6.3% |
| Kiowa | 0.0 /100 | #287 | Tragic 6.3% |
| Cree | 0.0 /100 | #288 | Tragic 6.3% |
| Immigrants | Caribbean | 0.0 /100 | #289 | Tragic 6.4% |
| Blackfeet | 0.0 /100 | #290 | Tragic 6.4% |
Demographics Similar to Immigrants from Western Asia by Unemployment Among Women with Children Under 18 years
In terms of unemployment among women with children under 18 years, the demographic groups most similar to Immigrants from Western Asia are Immigrants from Costa Rica (5.6%, a difference of 0.060%), Nonimmigrants (5.7%, a difference of 0.11%), Peruvian (5.6%, a difference of 0.13%), Nicaraguan (5.6%, a difference of 0.18%), and Panamanian (5.7%, a difference of 0.22%).
| Demographics | Rating | Rank | Unemployment Among Women with Children Under 18 years |
| Immigrants | Micronesia | 17.1 /100 | #202 | Poor 5.6% |
| Portuguese | 15.9 /100 | #203 | Poor 5.6% |
| Israelis | 15.6 /100 | #204 | Poor 5.6% |
| Tsimshian | 15.2 /100 | #205 | Poor 5.6% |
| Nicaraguans | 12.3 /100 | #206 | Poor 5.6% |
| Peruvians | 12.1 /100 | #207 | Poor 5.6% |
| Immigrants | Costa Rica | 11.6 /100 | #208 | Poor 5.6% |
| Immigrants | Western Asia | 11.3 /100 | #209 | Poor 5.6% |
| Immigrants | Nonimmigrants | 10.6 /100 | #210 | Poor 5.7% |
| Panamanians | 10.1 /100 | #211 | Poor 5.7% |
| South Americans | 10.0 /100 | #212 | Poor 5.7% |
| Americans | 8.9 /100 | #213 | Tragic 5.7% |
| Japanese | 8.7 /100 | #214 | Tragic 5.7% |
| Immigrants | Uganda | 7.9 /100 | #215 | Tragic 5.7% |
| Immigrants | Peru | 7.4 /100 | #216 | Tragic 5.7% |