Nonimmigrants vs Immigrants from Western Asia Unemployment Among Women with Children Under 18 years
COMPARE
Nonimmigrants
Immigrants from Western Asia
Unemployment Among Women with Children Under 18 years
Unemployment Among Women with Children Under 18 years Comparison
Nonimmigrants
Immigrants from Western Asia
5.7%
UNEMPLOYMENT AMONG WOMEN WITH CHILDREN UNDER 18 YEARS
10.6/ 100
METRIC RATING
210th/ 347
METRIC RANK
5.6%
UNEMPLOYMENT AMONG WOMEN WITH CHILDREN UNDER 18 YEARS
11.3/ 100
METRIC RATING
209th/ 347
METRIC RANK
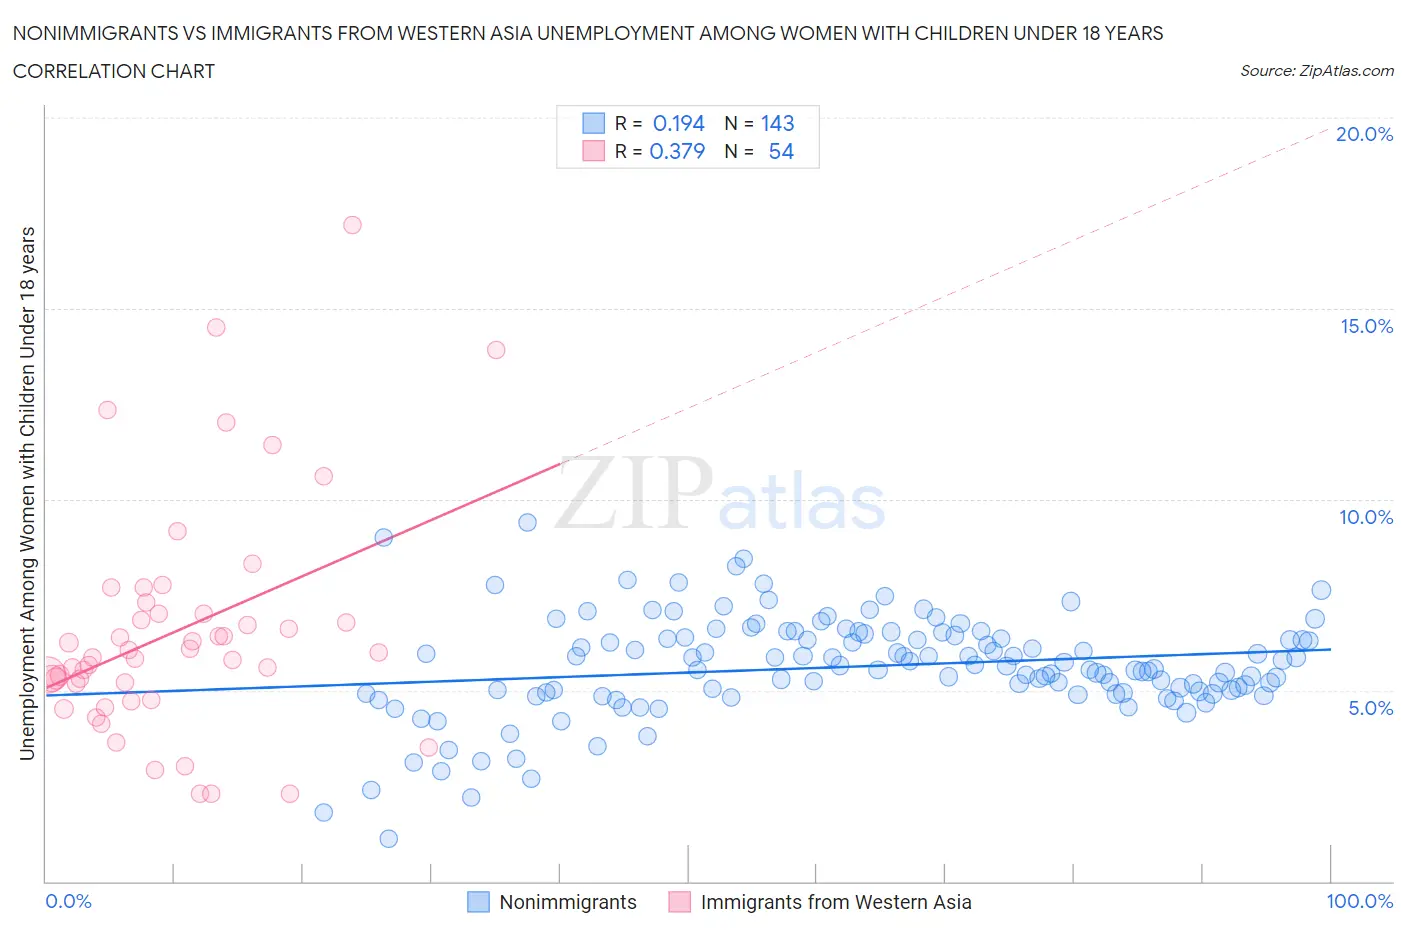
Nonimmigrants vs Immigrants from Western Asia Unemployment Among Women with Children Under 18 years Correlation Chart
The statistical analysis conducted on geographies consisting of 514,953,140 people shows a poor positive correlation between the proportion of Nonimmigrants and unemployment rate among women with children under the age of 18 in the United States with a correlation coefficient (R) of 0.194 and weighted average of 5.7%. Similarly, the statistical analysis conducted on geographies consisting of 389,254,890 people shows a mild positive correlation between the proportion of Immigrants from Western Asia and unemployment rate among women with children under the age of 18 in the United States with a correlation coefficient (R) of 0.379 and weighted average of 5.6%, a difference of 0.11%.
Unemployment Among Women with Children Under 18 years Correlation Summary
| Measurement | Nonimmigrants | Immigrants from Western Asia |
| Minimum | 1.1% | 2.3% |
| Maximum | 9.4% | 17.2% |
| Range | 8.3% | 14.9% |
| Mean | 5.6% | 6.6% |
| Median | 5.6% | 5.9% |
| Interquartile 25% (IQ1) | 4.9% | 5.2% |
| Interquartile 75% (IQ3) | 6.4% | 7.0% |
| Interquartile Range (IQR) | 1.5% | 1.8% |
| Standard Deviation (Sample) | 1.3% | 3.0% |
| Standard Deviation (Population) | 1.3% | 3.0% |
Demographics Similar to Nonimmigrants and Immigrants from Western Asia by Unemployment Among Women with Children Under 18 years
In terms of unemployment among women with children under 18 years, the demographic groups most similar to Nonimmigrants are Panamanian (5.7%, a difference of 0.11%), South American (5.7%, a difference of 0.12%), Immigrants from Costa Rica (5.6%, a difference of 0.17%), Peruvian (5.6%, a difference of 0.24%), and Nicaraguan (5.6%, a difference of 0.29%). Similarly, the demographic groups most similar to Immigrants from Western Asia are Immigrants from Costa Rica (5.6%, a difference of 0.060%), Peruvian (5.6%, a difference of 0.13%), Nicaraguan (5.6%, a difference of 0.18%), Panamanian (5.7%, a difference of 0.22%), and South American (5.7%, a difference of 0.23%).
| Demographics | Rating | Rank | Unemployment Among Women with Children Under 18 years |
| Marshallese | 20.2 /100 | #199 | Fair 5.6% |
| Menominee | 18.6 /100 | #200 | Poor 5.6% |
| Immigrants | Morocco | 17.9 /100 | #201 | Poor 5.6% |
| Immigrants | Micronesia | 17.1 /100 | #202 | Poor 5.6% |
| Portuguese | 15.9 /100 | #203 | Poor 5.6% |
| Israelis | 15.6 /100 | #204 | Poor 5.6% |
| Tsimshian | 15.2 /100 | #205 | Poor 5.6% |
| Nicaraguans | 12.3 /100 | #206 | Poor 5.6% |
| Peruvians | 12.1 /100 | #207 | Poor 5.6% |
| Immigrants | Costa Rica | 11.6 /100 | #208 | Poor 5.6% |
| Immigrants | Western Asia | 11.3 /100 | #209 | Poor 5.6% |
| Immigrants | Nonimmigrants | 10.6 /100 | #210 | Poor 5.7% |
| Panamanians | 10.1 /100 | #211 | Poor 5.7% |
| South Americans | 10.0 /100 | #212 | Poor 5.7% |
| Americans | 8.9 /100 | #213 | Tragic 5.7% |
| Japanese | 8.7 /100 | #214 | Tragic 5.7% |
| Immigrants | Uganda | 7.9 /100 | #215 | Tragic 5.7% |
| Immigrants | Peru | 7.4 /100 | #216 | Tragic 5.7% |
| Immigrants | Brazil | 7.1 /100 | #217 | Tragic 5.7% |
| Immigrants | Nicaragua | 7.0 /100 | #218 | Tragic 5.7% |
| Iroquois | 6.5 /100 | #219 | Tragic 5.7% |