West Indian vs Immigrants from Morocco Unemployment Among Ages 20 to 24 years
COMPARE
West Indian
Immigrants from Morocco
Unemployment Among Ages 20 to 24 years
Unemployment Among Ages 20 to 24 years Comparison
West Indians
Immigrants from Morocco
12.8%
UNEMPLOYMENT AMONG AGES 20 TO 24 YEARS
0.0/ 100
METRIC RATING
315th/ 347
METRIC RANK
10.1%
UNEMPLOYMENT AMONG AGES 20 TO 24 YEARS
90.5/ 100
METRIC RATING
115th/ 347
METRIC RANK
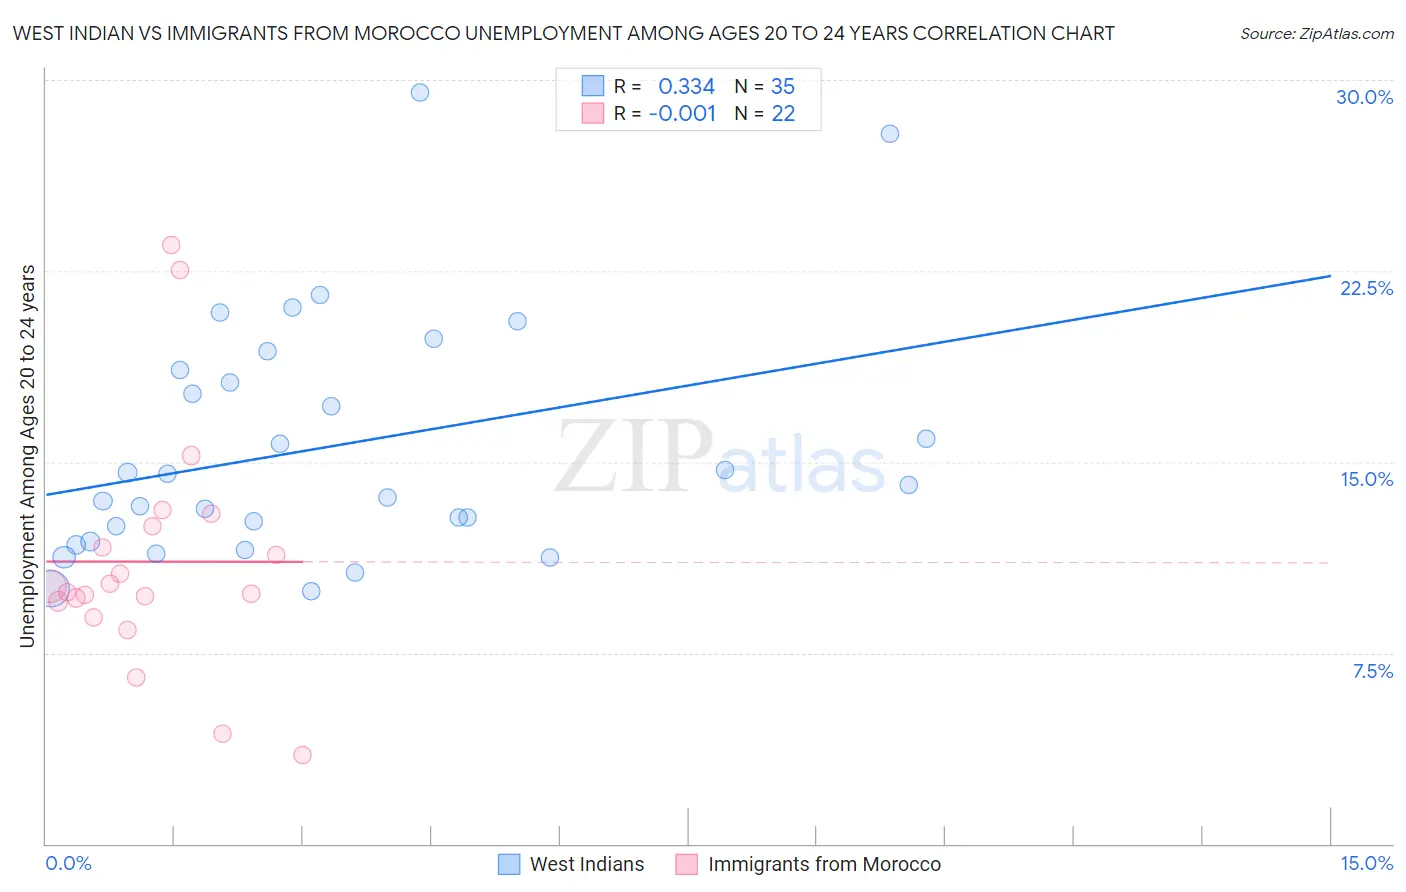
West Indian vs Immigrants from Morocco Unemployment Among Ages 20 to 24 years Correlation Chart
The statistical analysis conducted on geographies consisting of 250,382,196 people shows a mild positive correlation between the proportion of West Indians and unemployment rate among population between the ages 20 and 24 in the United States with a correlation coefficient (R) of 0.334 and weighted average of 12.8%. Similarly, the statistical analysis conducted on geographies consisting of 177,201,204 people shows no correlation between the proportion of Immigrants from Morocco and unemployment rate among population between the ages 20 and 24 in the United States with a correlation coefficient (R) of -0.001 and weighted average of 10.1%, a difference of 26.4%.
Unemployment Among Ages 20 to 24 years Correlation Summary
| Measurement | West Indian | Immigrants from Morocco |
| Minimum | 9.9% | 3.5% |
| Maximum | 29.5% | 23.5% |
| Range | 19.6% | 20.0% |
| Mean | 15.6% | 11.1% |
| Median | 14.1% | 10.0% |
| Interquartile 25% (IQ1) | 11.9% | 9.5% |
| Interquartile 75% (IQ3) | 18.6% | 12.5% |
| Interquartile Range (IQR) | 6.7% | 3.0% |
| Standard Deviation (Sample) | 4.7% | 4.7% |
| Standard Deviation (Population) | 4.7% | 4.6% |
Similar Demographics by Unemployment Among Ages 20 to 24 years
Demographics Similar to West Indians by Unemployment Among Ages 20 to 24 years
In terms of unemployment among ages 20 to 24 years, the demographic groups most similar to West Indians are Black/African American (12.7%, a difference of 0.21%), Shoshone (12.7%, a difference of 0.40%), Immigrants from Dominica (12.8%, a difference of 0.48%), Immigrants from Trinidad and Tobago (12.8%, a difference of 0.60%), and Barbadian (12.9%, a difference of 0.85%).
| Demographics | Rating | Rank | Unemployment Among Ages 20 to 24 years |
| Tohono O'odham | 0.0 /100 | #308 | Tragic 12.5% |
| Immigrants | Bangladesh | 0.0 /100 | #309 | Tragic 12.6% |
| Jamaicans | 0.0 /100 | #310 | Tragic 12.6% |
| Vietnamese | 0.0 /100 | #311 | Tragic 12.6% |
| Houma | 0.0 /100 | #312 | Tragic 12.6% |
| Shoshone | 0.0 /100 | #313 | Tragic 12.7% |
| Blacks/African Americans | 0.0 /100 | #314 | Tragic 12.7% |
| West Indians | 0.0 /100 | #315 | Tragic 12.8% |
| Immigrants | Dominica | 0.0 /100 | #316 | Tragic 12.8% |
| Immigrants | Trinidad and Tobago | 0.0 /100 | #317 | Tragic 12.8% |
| Barbadians | 0.0 /100 | #318 | Tragic 12.9% |
| Trinidadians and Tobagonians | 0.0 /100 | #319 | Tragic 12.9% |
| Cheyenne | 0.0 /100 | #320 | Tragic 13.0% |
| Immigrants | Jamaica | 0.0 /100 | #321 | Tragic 13.0% |
| Natives/Alaskans | 0.0 /100 | #322 | Tragic 13.0% |
Demographics Similar to Immigrants from Morocco by Unemployment Among Ages 20 to 24 years
In terms of unemployment among ages 20 to 24 years, the demographic groups most similar to Immigrants from Morocco are Ottawa (10.1%, a difference of 0.040%), Basque (10.1%, a difference of 0.070%), Immigrants from Uruguay (10.1%, a difference of 0.090%), Paraguayan (10.1%, a difference of 0.19%), and French (10.1%, a difference of 0.22%).
| Demographics | Rating | Rank | Unemployment Among Ages 20 to 24 years |
| Immigrants | Latvia | 93.2 /100 | #108 | Exceptional 10.1% |
| Filipinos | 93.2 /100 | #109 | Exceptional 10.1% |
| Immigrants | Spain | 93.1 /100 | #110 | Exceptional 10.1% |
| Immigrants | Indonesia | 92.7 /100 | #111 | Exceptional 10.1% |
| Northern Europeans | 92.7 /100 | #112 | Exceptional 10.1% |
| German Russians | 92.4 /100 | #113 | Exceptional 10.1% |
| Ottawa | 90.8 /100 | #114 | Exceptional 10.1% |
| Immigrants | Morocco | 90.5 /100 | #115 | Exceptional 10.1% |
| Basques | 89.8 /100 | #116 | Excellent 10.1% |
| Immigrants | Uruguay | 89.6 /100 | #117 | Excellent 10.1% |
| Paraguayans | 88.6 /100 | #118 | Excellent 10.1% |
| French | 88.2 /100 | #119 | Excellent 10.1% |
| Immigrants | Canada | 88.2 /100 | #120 | Excellent 10.1% |
| South Africans | 87.8 /100 | #121 | Excellent 10.1% |
| Whites/Caucasians | 87.4 /100 | #122 | Excellent 10.1% |