Immigrants from Japan vs Immigrants from Morocco Unemployment Among Ages 20 to 24 years
COMPARE
Immigrants from Japan
Immigrants from Morocco
Unemployment Among Ages 20 to 24 years
Unemployment Among Ages 20 to 24 years Comparison
Immigrants from Japan
Immigrants from Morocco
10.1%
UNEMPLOYMENT AMONG AGES 20 TO 24 YEARS
86.5/ 100
METRIC RATING
124th/ 347
METRIC RANK
10.1%
UNEMPLOYMENT AMONG AGES 20 TO 24 YEARS
90.5/ 100
METRIC RATING
115th/ 347
METRIC RANK
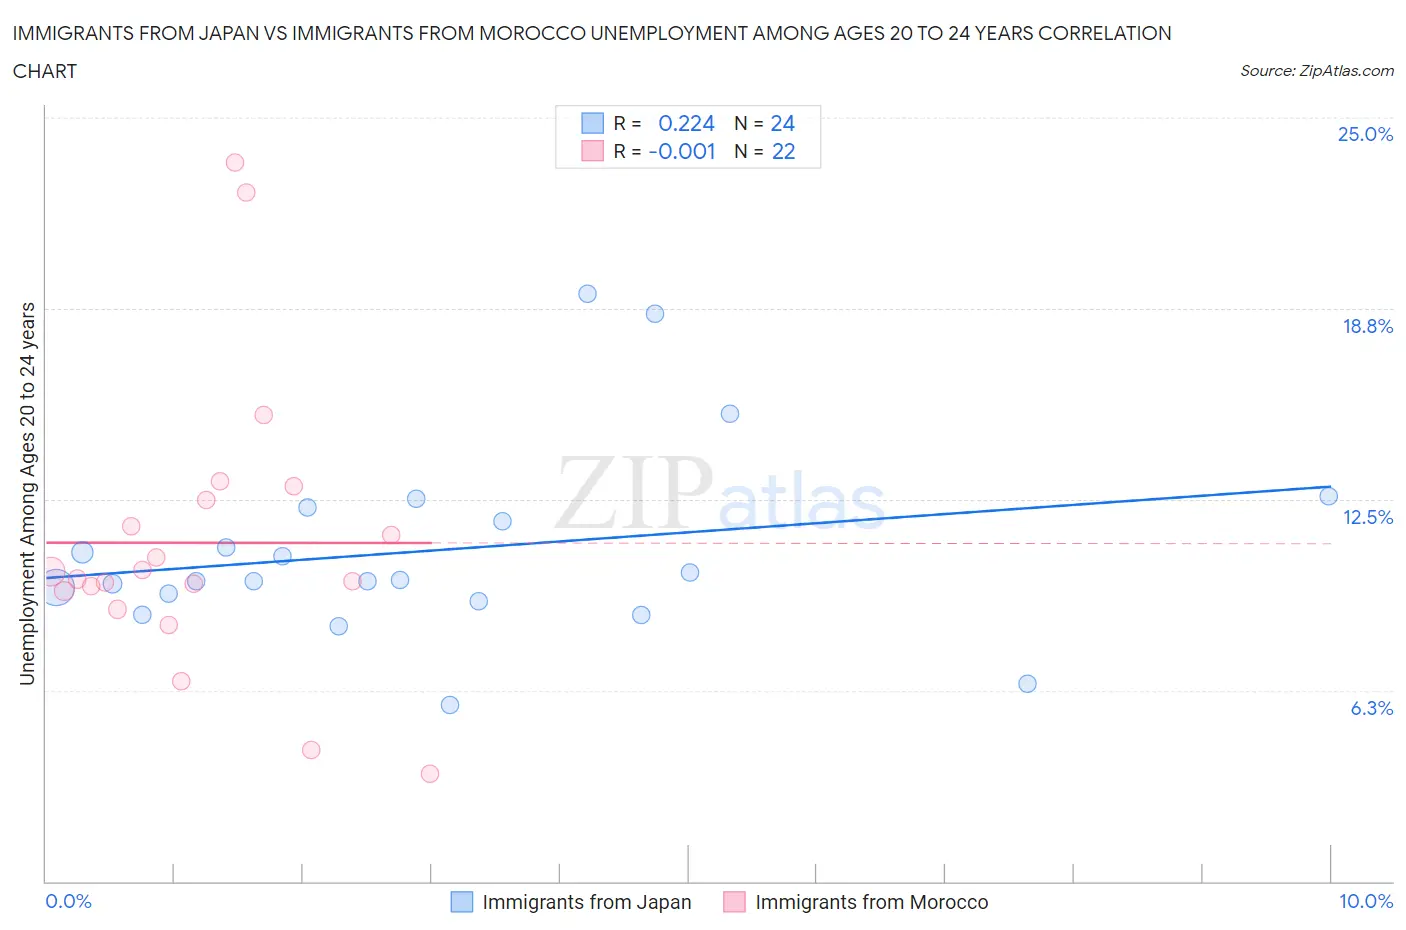
Immigrants from Japan vs Immigrants from Morocco Unemployment Among Ages 20 to 24 years Correlation Chart
The statistical analysis conducted on geographies consisting of 332,545,610 people shows a weak positive correlation between the proportion of Immigrants from Japan and unemployment rate among population between the ages 20 and 24 in the United States with a correlation coefficient (R) of 0.224 and weighted average of 10.1%. Similarly, the statistical analysis conducted on geographies consisting of 177,201,204 people shows no correlation between the proportion of Immigrants from Morocco and unemployment rate among population between the ages 20 and 24 in the United States with a correlation coefficient (R) of -0.001 and weighted average of 10.1%, a difference of 0.37%.
Unemployment Among Ages 20 to 24 years Correlation Summary
| Measurement | Immigrants from Japan | Immigrants from Morocco |
| Minimum | 5.8% | 3.5% |
| Maximum | 19.2% | 23.5% |
| Range | 13.5% | 20.0% |
| Mean | 10.8% | 11.1% |
| Median | 9.8% | 10.0% |
| Interquartile 25% (IQ1) | 9.3% | 9.5% |
| Interquartile 75% (IQ3) | 12.0% | 12.5% |
| Interquartile Range (IQR) | 2.7% | 3.0% |
| Standard Deviation (Sample) | 3.2% | 4.7% |
| Standard Deviation (Population) | 3.1% | 4.6% |
Demographics Similar to Immigrants from Japan and Immigrants from Morocco by Unemployment Among Ages 20 to 24 years
In terms of unemployment among ages 20 to 24 years, the demographic groups most similar to Immigrants from Japan are Spanish (10.1%, a difference of 0.030%), Jordanian (10.1%, a difference of 0.030%), Immigrants from Iraq (10.1%, a difference of 0.050%), White/Caucasian (10.1%, a difference of 0.070%), and Immigrants from Norway (10.1%, a difference of 0.090%). Similarly, the demographic groups most similar to Immigrants from Morocco are Ottawa (10.1%, a difference of 0.040%), Basque (10.1%, a difference of 0.070%), Immigrants from Uruguay (10.1%, a difference of 0.090%), Paraguayan (10.1%, a difference of 0.19%), and French (10.1%, a difference of 0.22%).
| Demographics | Rating | Rank | Unemployment Among Ages 20 to 24 years |
| Filipinos | 93.2 /100 | #109 | Exceptional 10.1% |
| Immigrants | Spain | 93.1 /100 | #110 | Exceptional 10.1% |
| Immigrants | Indonesia | 92.7 /100 | #111 | Exceptional 10.1% |
| Northern Europeans | 92.7 /100 | #112 | Exceptional 10.1% |
| German Russians | 92.4 /100 | #113 | Exceptional 10.1% |
| Ottawa | 90.8 /100 | #114 | Exceptional 10.1% |
| Immigrants | Morocco | 90.5 /100 | #115 | Exceptional 10.1% |
| Basques | 89.8 /100 | #116 | Excellent 10.1% |
| Immigrants | Uruguay | 89.6 /100 | #117 | Excellent 10.1% |
| Paraguayans | 88.6 /100 | #118 | Excellent 10.1% |
| French | 88.2 /100 | #119 | Excellent 10.1% |
| Immigrants | Canada | 88.2 /100 | #120 | Excellent 10.1% |
| South Africans | 87.8 /100 | #121 | Excellent 10.1% |
| Whites/Caucasians | 87.4 /100 | #122 | Excellent 10.1% |
| Immigrants | Iraq | 87.1 /100 | #123 | Excellent 10.1% |
| Immigrants | Japan | 86.5 /100 | #124 | Excellent 10.1% |
| Spanish | 86.1 /100 | #125 | Excellent 10.1% |
| Jordanians | 86.1 /100 | #126 | Excellent 10.1% |
| Immigrants | Norway | 85.3 /100 | #127 | Excellent 10.1% |
| Immigrants | Brazil | 84.9 /100 | #128 | Excellent 10.1% |
| Immigrants | South Central Asia | 84.6 /100 | #129 | Excellent 10.1% |