West Indian vs Immigrants from Brazil Unemployment Among Women with Children Under 6 years
COMPARE
West Indian
Immigrants from Brazil
Unemployment Among Women with Children Under 6 years
Unemployment Among Women with Children Under 6 years Comparison
West Indians
Immigrants from Brazil
8.4%
UNEMPLOYMENT AMONG WOMEN WITH CHILDREN UNDER 6 YEARS
0.3/ 100
METRIC RATING
262nd/ 347
METRIC RANK
7.5%
UNEMPLOYMENT AMONG WOMEN WITH CHILDREN UNDER 6 YEARS
77.3/ 100
METRIC RATING
148th/ 347
METRIC RANK
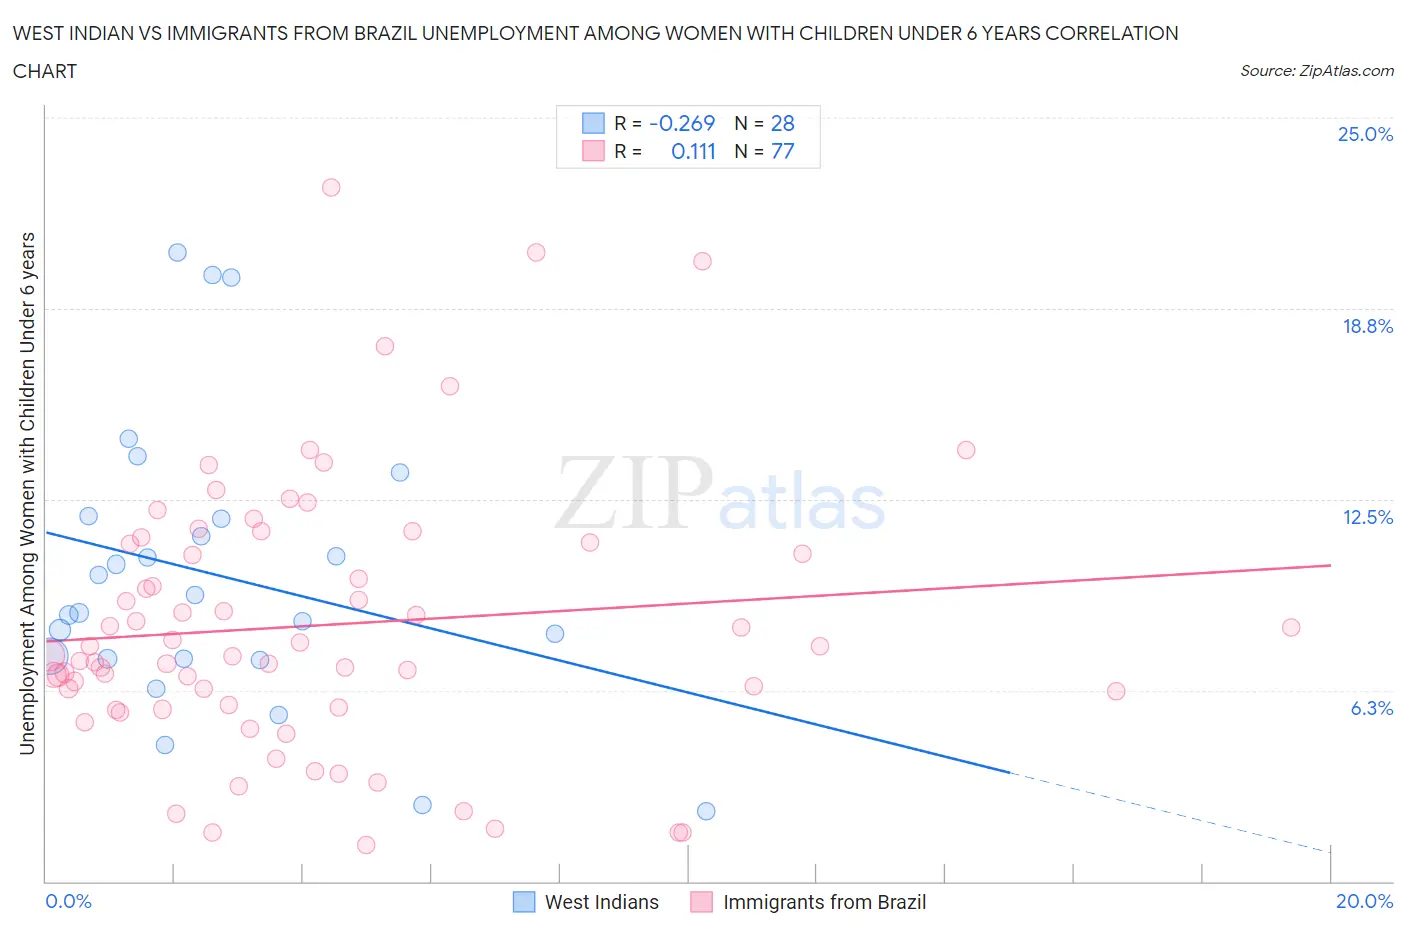
West Indian vs Immigrants from Brazil Unemployment Among Women with Children Under 6 years Correlation Chart
The statistical analysis conducted on geographies consisting of 210,232,291 people shows a weak negative correlation between the proportion of West Indians and unemployment rate among women with children under the age of 6 in the United States with a correlation coefficient (R) of -0.269 and weighted average of 8.4%. Similarly, the statistical analysis conducted on geographies consisting of 268,259,318 people shows a poor positive correlation between the proportion of Immigrants from Brazil and unemployment rate among women with children under the age of 6 in the United States with a correlation coefficient (R) of 0.111 and weighted average of 7.5%, a difference of 12.0%.
Unemployment Among Women with Children Under 6 years Correlation Summary
| Measurement | West Indian | Immigrants from Brazil |
| Minimum | 2.3% | 1.2% |
| Maximum | 20.6% | 22.7% |
| Range | 18.3% | 21.5% |
| Mean | 10.0% | 8.4% |
| Median | 9.1% | 7.4% |
| Interquartile 25% (IQ1) | 7.3% | 5.7% |
| Interquartile 75% (IQ3) | 11.9% | 11.1% |
| Interquartile Range (IQR) | 4.6% | 5.3% |
| Standard Deviation (Sample) | 4.6% | 4.4% |
| Standard Deviation (Population) | 4.6% | 4.4% |
Similar Demographics by Unemployment Among Women with Children Under 6 years
Demographics Similar to West Indians by Unemployment Among Women with Children Under 6 years
In terms of unemployment among women with children under 6 years, the demographic groups most similar to West Indians are Immigrants from Liberia (8.4%, a difference of 0.010%), Scotch-Irish (8.4%, a difference of 0.030%), Honduran (8.4%, a difference of 0.050%), French Canadian (8.4%, a difference of 0.10%), and Immigrants from Honduras (8.4%, a difference of 0.11%).
| Demographics | Rating | Rank | Unemployment Among Women with Children Under 6 years |
| Immigrants | Portugal | 0.6 /100 | #255 | Tragic 8.3% |
| Celtics | 0.6 /100 | #256 | Tragic 8.3% |
| British West Indians | 0.5 /100 | #257 | Tragic 8.3% |
| Immigrants | Ghana | 0.5 /100 | #258 | Tragic 8.3% |
| Barbadians | 0.4 /100 | #259 | Tragic 8.3% |
| Whites/Caucasians | 0.3 /100 | #260 | Tragic 8.4% |
| Immigrants | Liberia | 0.3 /100 | #261 | Tragic 8.4% |
| West Indians | 0.3 /100 | #262 | Tragic 8.4% |
| Scotch-Irish | 0.3 /100 | #263 | Tragic 8.4% |
| Hondurans | 0.3 /100 | #264 | Tragic 8.4% |
| French Canadians | 0.3 /100 | #265 | Tragic 8.4% |
| Immigrants | Honduras | 0.3 /100 | #266 | Tragic 8.4% |
| Belizeans | 0.2 /100 | #267 | Tragic 8.4% |
| Sub-Saharan Africans | 0.2 /100 | #268 | Tragic 8.4% |
| Immigrants | Haiti | 0.2 /100 | #269 | Tragic 8.4% |
Demographics Similar to Immigrants from Brazil by Unemployment Among Women with Children Under 6 years
In terms of unemployment among women with children under 6 years, the demographic groups most similar to Immigrants from Brazil are Immigrants from Oceania (7.5%, a difference of 0.11%), Colombian (7.5%, a difference of 0.12%), Aleut (7.5%, a difference of 0.12%), Immigrants from Jordan (7.5%, a difference of 0.16%), and Japanese (7.5%, a difference of 0.16%).
| Demographics | Rating | Rank | Unemployment Among Women with Children Under 6 years |
| Greeks | 82.6 /100 | #141 | Excellent 7.4% |
| Immigrants | Argentina | 81.5 /100 | #142 | Excellent 7.5% |
| Koreans | 81.3 /100 | #143 | Excellent 7.5% |
| Europeans | 79.1 /100 | #144 | Good 7.5% |
| Immigrants | Jordan | 78.9 /100 | #145 | Good 7.5% |
| Japanese | 78.9 /100 | #146 | Good 7.5% |
| Immigrants | Oceania | 78.4 /100 | #147 | Good 7.5% |
| Immigrants | Brazil | 77.3 /100 | #148 | Good 7.5% |
| Colombians | 76.1 /100 | #149 | Good 7.5% |
| Aleuts | 76.0 /100 | #150 | Good 7.5% |
| Immigrants | Peru | 74.9 /100 | #151 | Good 7.5% |
| Bangladeshis | 74.8 /100 | #152 | Good 7.5% |
| Uruguayans | 74.7 /100 | #153 | Good 7.5% |
| Northern Europeans | 74.3 /100 | #154 | Good 7.5% |
| South Americans | 74.1 /100 | #155 | Good 7.5% |