West Indian vs Puget Sound Salish Unemployment Among Women with Children Under 6 years
COMPARE
West Indian
Puget Sound Salish
Unemployment Among Women with Children Under 6 years
Unemployment Among Women with Children Under 6 years Comparison
West Indians
Puget Sound Salish
8.4%
UNEMPLOYMENT AMONG WOMEN WITH CHILDREN UNDER 6 YEARS
0.3/ 100
METRIC RATING
262nd/ 347
METRIC RANK
7.7%
UNEMPLOYMENT AMONG WOMEN WITH CHILDREN UNDER 6 YEARS
47.7/ 100
METRIC RATING
176th/ 347
METRIC RANK
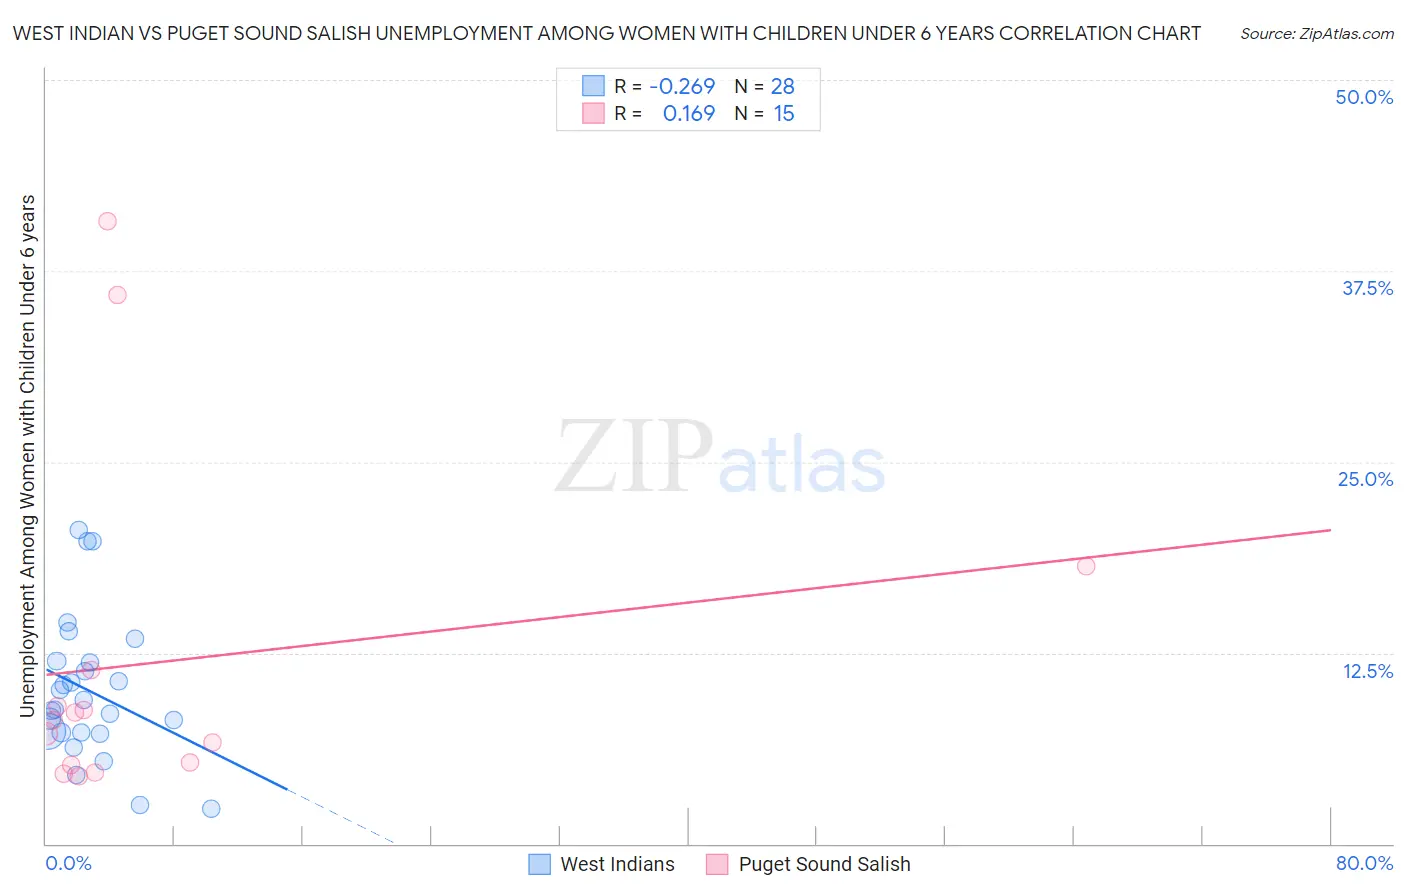
West Indian vs Puget Sound Salish Unemployment Among Women with Children Under 6 years Correlation Chart
The statistical analysis conducted on geographies consisting of 210,232,291 people shows a weak negative correlation between the proportion of West Indians and unemployment rate among women with children under the age of 6 in the United States with a correlation coefficient (R) of -0.269 and weighted average of 8.4%. Similarly, the statistical analysis conducted on geographies consisting of 41,635,771 people shows a poor positive correlation between the proportion of Puget Sound Salish and unemployment rate among women with children under the age of 6 in the United States with a correlation coefficient (R) of 0.169 and weighted average of 7.7%, a difference of 9.6%.
Unemployment Among Women with Children Under 6 years Correlation Summary
| Measurement | West Indian | Puget Sound Salish |
| Minimum | 2.3% | 4.4% |
| Maximum | 20.6% | 40.8% |
| Range | 18.3% | 36.3% |
| Mean | 10.0% | 11.9% |
| Median | 9.1% | 8.1% |
| Interquartile 25% (IQ1) | 7.3% | 5.2% |
| Interquartile 75% (IQ3) | 11.9% | 11.4% |
| Interquartile Range (IQR) | 4.6% | 6.2% |
| Standard Deviation (Sample) | 4.6% | 11.3% |
| Standard Deviation (Population) | 4.6% | 10.9% |
Similar Demographics by Unemployment Among Women with Children Under 6 years
Demographics Similar to West Indians by Unemployment Among Women with Children Under 6 years
In terms of unemployment among women with children under 6 years, the demographic groups most similar to West Indians are Immigrants from Liberia (8.4%, a difference of 0.010%), Scotch-Irish (8.4%, a difference of 0.030%), Honduran (8.4%, a difference of 0.050%), French Canadian (8.4%, a difference of 0.10%), and Immigrants from Honduras (8.4%, a difference of 0.11%).
| Demographics | Rating | Rank | Unemployment Among Women with Children Under 6 years |
| Immigrants | Portugal | 0.6 /100 | #255 | Tragic 8.3% |
| Celtics | 0.6 /100 | #256 | Tragic 8.3% |
| British West Indians | 0.5 /100 | #257 | Tragic 8.3% |
| Immigrants | Ghana | 0.5 /100 | #258 | Tragic 8.3% |
| Barbadians | 0.4 /100 | #259 | Tragic 8.3% |
| Whites/Caucasians | 0.3 /100 | #260 | Tragic 8.4% |
| Immigrants | Liberia | 0.3 /100 | #261 | Tragic 8.4% |
| West Indians | 0.3 /100 | #262 | Tragic 8.4% |
| Scotch-Irish | 0.3 /100 | #263 | Tragic 8.4% |
| Hondurans | 0.3 /100 | #264 | Tragic 8.4% |
| French Canadians | 0.3 /100 | #265 | Tragic 8.4% |
| Immigrants | Honduras | 0.3 /100 | #266 | Tragic 8.4% |
| Belizeans | 0.2 /100 | #267 | Tragic 8.4% |
| Sub-Saharan Africans | 0.2 /100 | #268 | Tragic 8.4% |
| Immigrants | Haiti | 0.2 /100 | #269 | Tragic 8.4% |
Demographics Similar to Puget Sound Salish by Unemployment Among Women with Children Under 6 years
In terms of unemployment among women with children under 6 years, the demographic groups most similar to Puget Sound Salish are Austrian (7.7%, a difference of 0.12%), Panamanian (7.6%, a difference of 0.13%), Immigrants from Laos (7.6%, a difference of 0.15%), Immigrants from England (7.7%, a difference of 0.16%), and Immigrants from Western Europe (7.7%, a difference of 0.19%).
| Demographics | Rating | Rank | Unemployment Among Women with Children Under 6 years |
| Immigrants | Scotland | 61.3 /100 | #169 | Good 7.6% |
| Czechs | 59.8 /100 | #170 | Average 7.6% |
| Immigrants | Grenada | 59.0 /100 | #171 | Average 7.6% |
| Immigrants | North America | 57.7 /100 | #172 | Average 7.6% |
| Cree | 51.6 /100 | #173 | Average 7.6% |
| Immigrants | Laos | 50.0 /100 | #174 | Average 7.6% |
| Panamanians | 49.6 /100 | #175 | Average 7.6% |
| Puget Sound Salish | 47.7 /100 | #176 | Average 7.7% |
| Austrians | 46.0 /100 | #177 | Average 7.7% |
| Immigrants | England | 45.4 /100 | #178 | Average 7.7% |
| Immigrants | Western Europe | 44.9 /100 | #179 | Average 7.7% |
| Immigrants | Uruguay | 44.5 /100 | #180 | Average 7.7% |
| Brazilians | 43.9 /100 | #181 | Average 7.7% |
| Nepalese | 43.5 /100 | #182 | Average 7.7% |
| Sierra Leoneans | 42.9 /100 | #183 | Average 7.7% |