West Indian vs Immigrants from Afghanistan Unemployment Among Ages 25 to 29 years
COMPARE
West Indian
Immigrants from Afghanistan
Unemployment Among Ages 25 to 29 years
Unemployment Among Ages 25 to 29 years Comparison
West Indians
Immigrants from Afghanistan
7.9%
UNEMPLOYMENT AMONG AGES 25 TO 29 YEARS
0.0/ 100
METRIC RATING
301st/ 347
METRIC RANK
6.5%
UNEMPLOYMENT AMONG AGES 25 TO 29 YEARS
79.2/ 100
METRIC RATING
131st/ 347
METRIC RANK
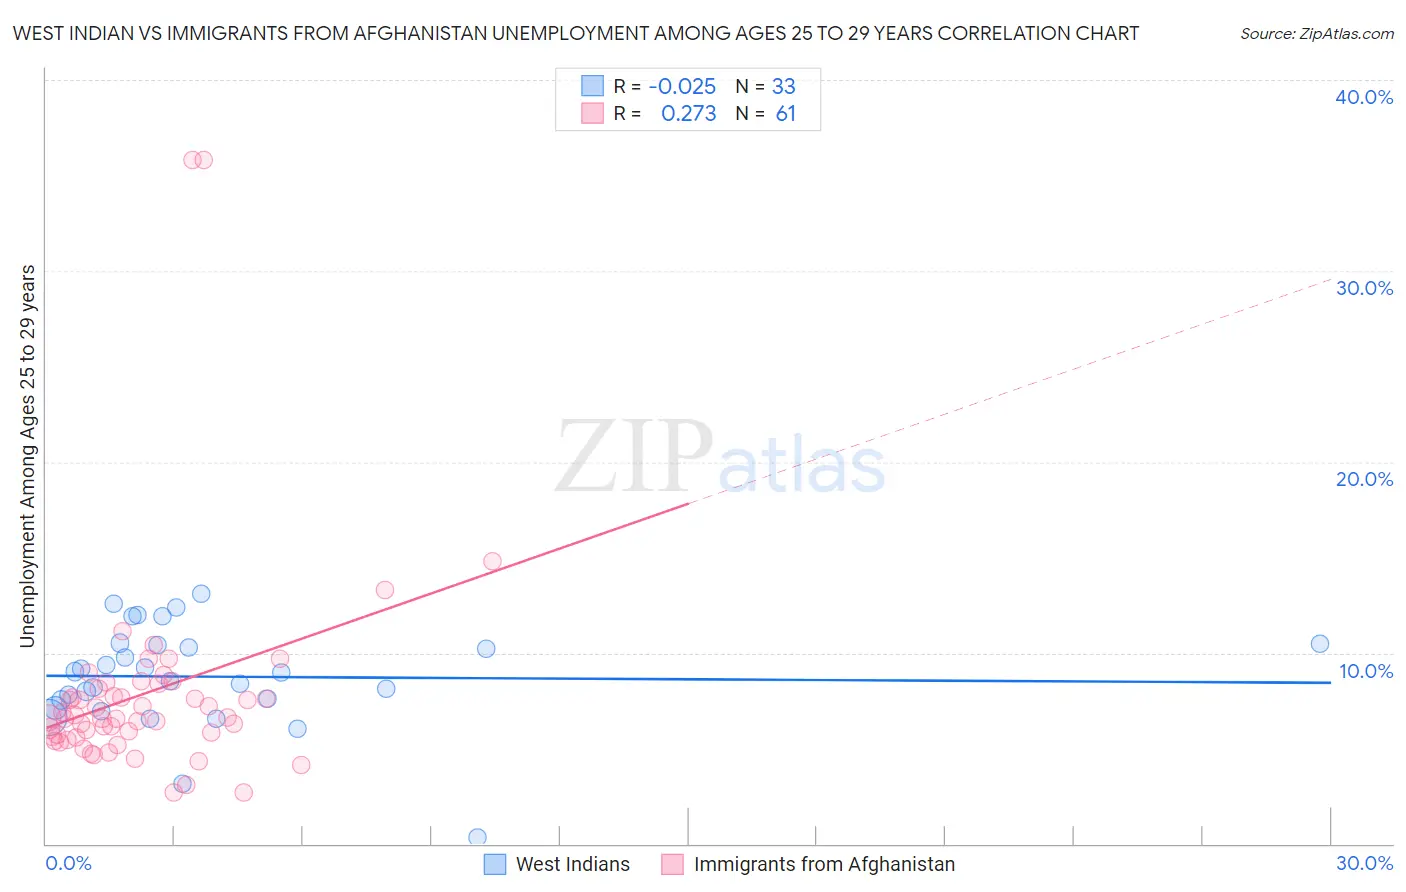
West Indian vs Immigrants from Afghanistan Unemployment Among Ages 25 to 29 years Correlation Chart
The statistical analysis conducted on geographies consisting of 247,262,358 people shows no correlation between the proportion of West Indians and unemployment rate among population between the ages 25 and 29 in the United States with a correlation coefficient (R) of -0.025 and weighted average of 7.9%. Similarly, the statistical analysis conducted on geographies consisting of 146,183,722 people shows a weak positive correlation between the proportion of Immigrants from Afghanistan and unemployment rate among population between the ages 25 and 29 in the United States with a correlation coefficient (R) of 0.273 and weighted average of 6.5%, a difference of 21.4%.
Unemployment Among Ages 25 to 29 years Correlation Summary
| Measurement | West Indian | Immigrants from Afghanistan |
| Minimum | 0.30% | 2.7% |
| Maximum | 13.1% | 35.8% |
| Range | 12.8% | 33.1% |
| Mean | 8.7% | 7.9% |
| Median | 9.0% | 6.6% |
| Interquartile 25% (IQ1) | 7.3% | 5.6% |
| Interquartile 75% (IQ3) | 10.4% | 8.2% |
| Interquartile Range (IQR) | 3.1% | 2.7% |
| Standard Deviation (Sample) | 2.7% | 5.6% |
| Standard Deviation (Population) | 2.6% | 5.6% |
Similar Demographics by Unemployment Among Ages 25 to 29 years
Demographics Similar to West Indians by Unemployment Among Ages 25 to 29 years
In terms of unemployment among ages 25 to 29 years, the demographic groups most similar to West Indians are Central American Indian (7.9%, a difference of 0.030%), Barbadian (7.9%, a difference of 0.050%), Jamaican (7.9%, a difference of 0.16%), Immigrants from Trinidad and Tobago (7.9%, a difference of 0.22%), and Blackfeet (7.9%, a difference of 0.48%).
| Demographics | Rating | Rank | Unemployment Among Ages 25 to 29 years |
| Trinidadians and Tobagonians | 0.0 /100 | #294 | Tragic 7.8% |
| Comanche | 0.0 /100 | #295 | Tragic 7.8% |
| Immigrants | West Indies | 0.0 /100 | #296 | Tragic 7.8% |
| Blackfeet | 0.0 /100 | #297 | Tragic 7.9% |
| Immigrants | Trinidad and Tobago | 0.0 /100 | #298 | Tragic 7.9% |
| Barbadians | 0.0 /100 | #299 | Tragic 7.9% |
| Central American Indians | 0.0 /100 | #300 | Tragic 7.9% |
| West Indians | 0.0 /100 | #301 | Tragic 7.9% |
| Jamaicans | 0.0 /100 | #302 | Tragic 7.9% |
| Immigrants | Yemen | 0.0 /100 | #303 | Tragic 8.0% |
| Cajuns | 0.0 /100 | #304 | Tragic 8.0% |
| Tsimshian | 0.0 /100 | #305 | Tragic 8.0% |
| Haitians | 0.0 /100 | #306 | Tragic 8.0% |
| Immigrants | Barbados | 0.0 /100 | #307 | Tragic 8.0% |
| Immigrants | Jamaica | 0.0 /100 | #308 | Tragic 8.1% |
Demographics Similar to Immigrants from Afghanistan by Unemployment Among Ages 25 to 29 years
In terms of unemployment among ages 25 to 29 years, the demographic groups most similar to Immigrants from Afghanistan are Immigrants from Peru (6.5%, a difference of 0.070%), Sri Lankan (6.5%, a difference of 0.11%), Immigrants from Chile (6.5%, a difference of 0.13%), Dutch (6.5%, a difference of 0.14%), and Polish (6.5%, a difference of 0.23%).
| Demographics | Rating | Rank | Unemployment Among Ages 25 to 29 years |
| Arabs | 82.5 /100 | #124 | Excellent 6.5% |
| Syrians | 82.1 /100 | #125 | Excellent 6.5% |
| Brazilians | 81.9 /100 | #126 | Excellent 6.5% |
| Dutch | 80.6 /100 | #127 | Excellent 6.5% |
| Immigrants | Chile | 80.5 /100 | #128 | Excellent 6.5% |
| Sri Lankans | 80.3 /100 | #129 | Excellent 6.5% |
| Immigrants | Peru | 79.9 /100 | #130 | Good 6.5% |
| Immigrants | Afghanistan | 79.2 /100 | #131 | Good 6.5% |
| Poles | 76.6 /100 | #132 | Good 6.5% |
| Immigrants | Europe | 75.7 /100 | #133 | Good 6.5% |
| Immigrants | Vietnam | 75.6 /100 | #134 | Good 6.5% |
| Immigrants | Croatia | 75.5 /100 | #135 | Good 6.5% |
| Northern Europeans | 75.4 /100 | #136 | Good 6.5% |
| Eastern Europeans | 74.1 /100 | #137 | Good 6.5% |
| Immigrants | Belgium | 73.8 /100 | #138 | Good 6.5% |